Posts Tagged ‘world’

2019 was a very good year for the world’s wealthiest individuals. The normal workings of global capitalism created both more billionaires and more combined wealth owned by those billionaires.

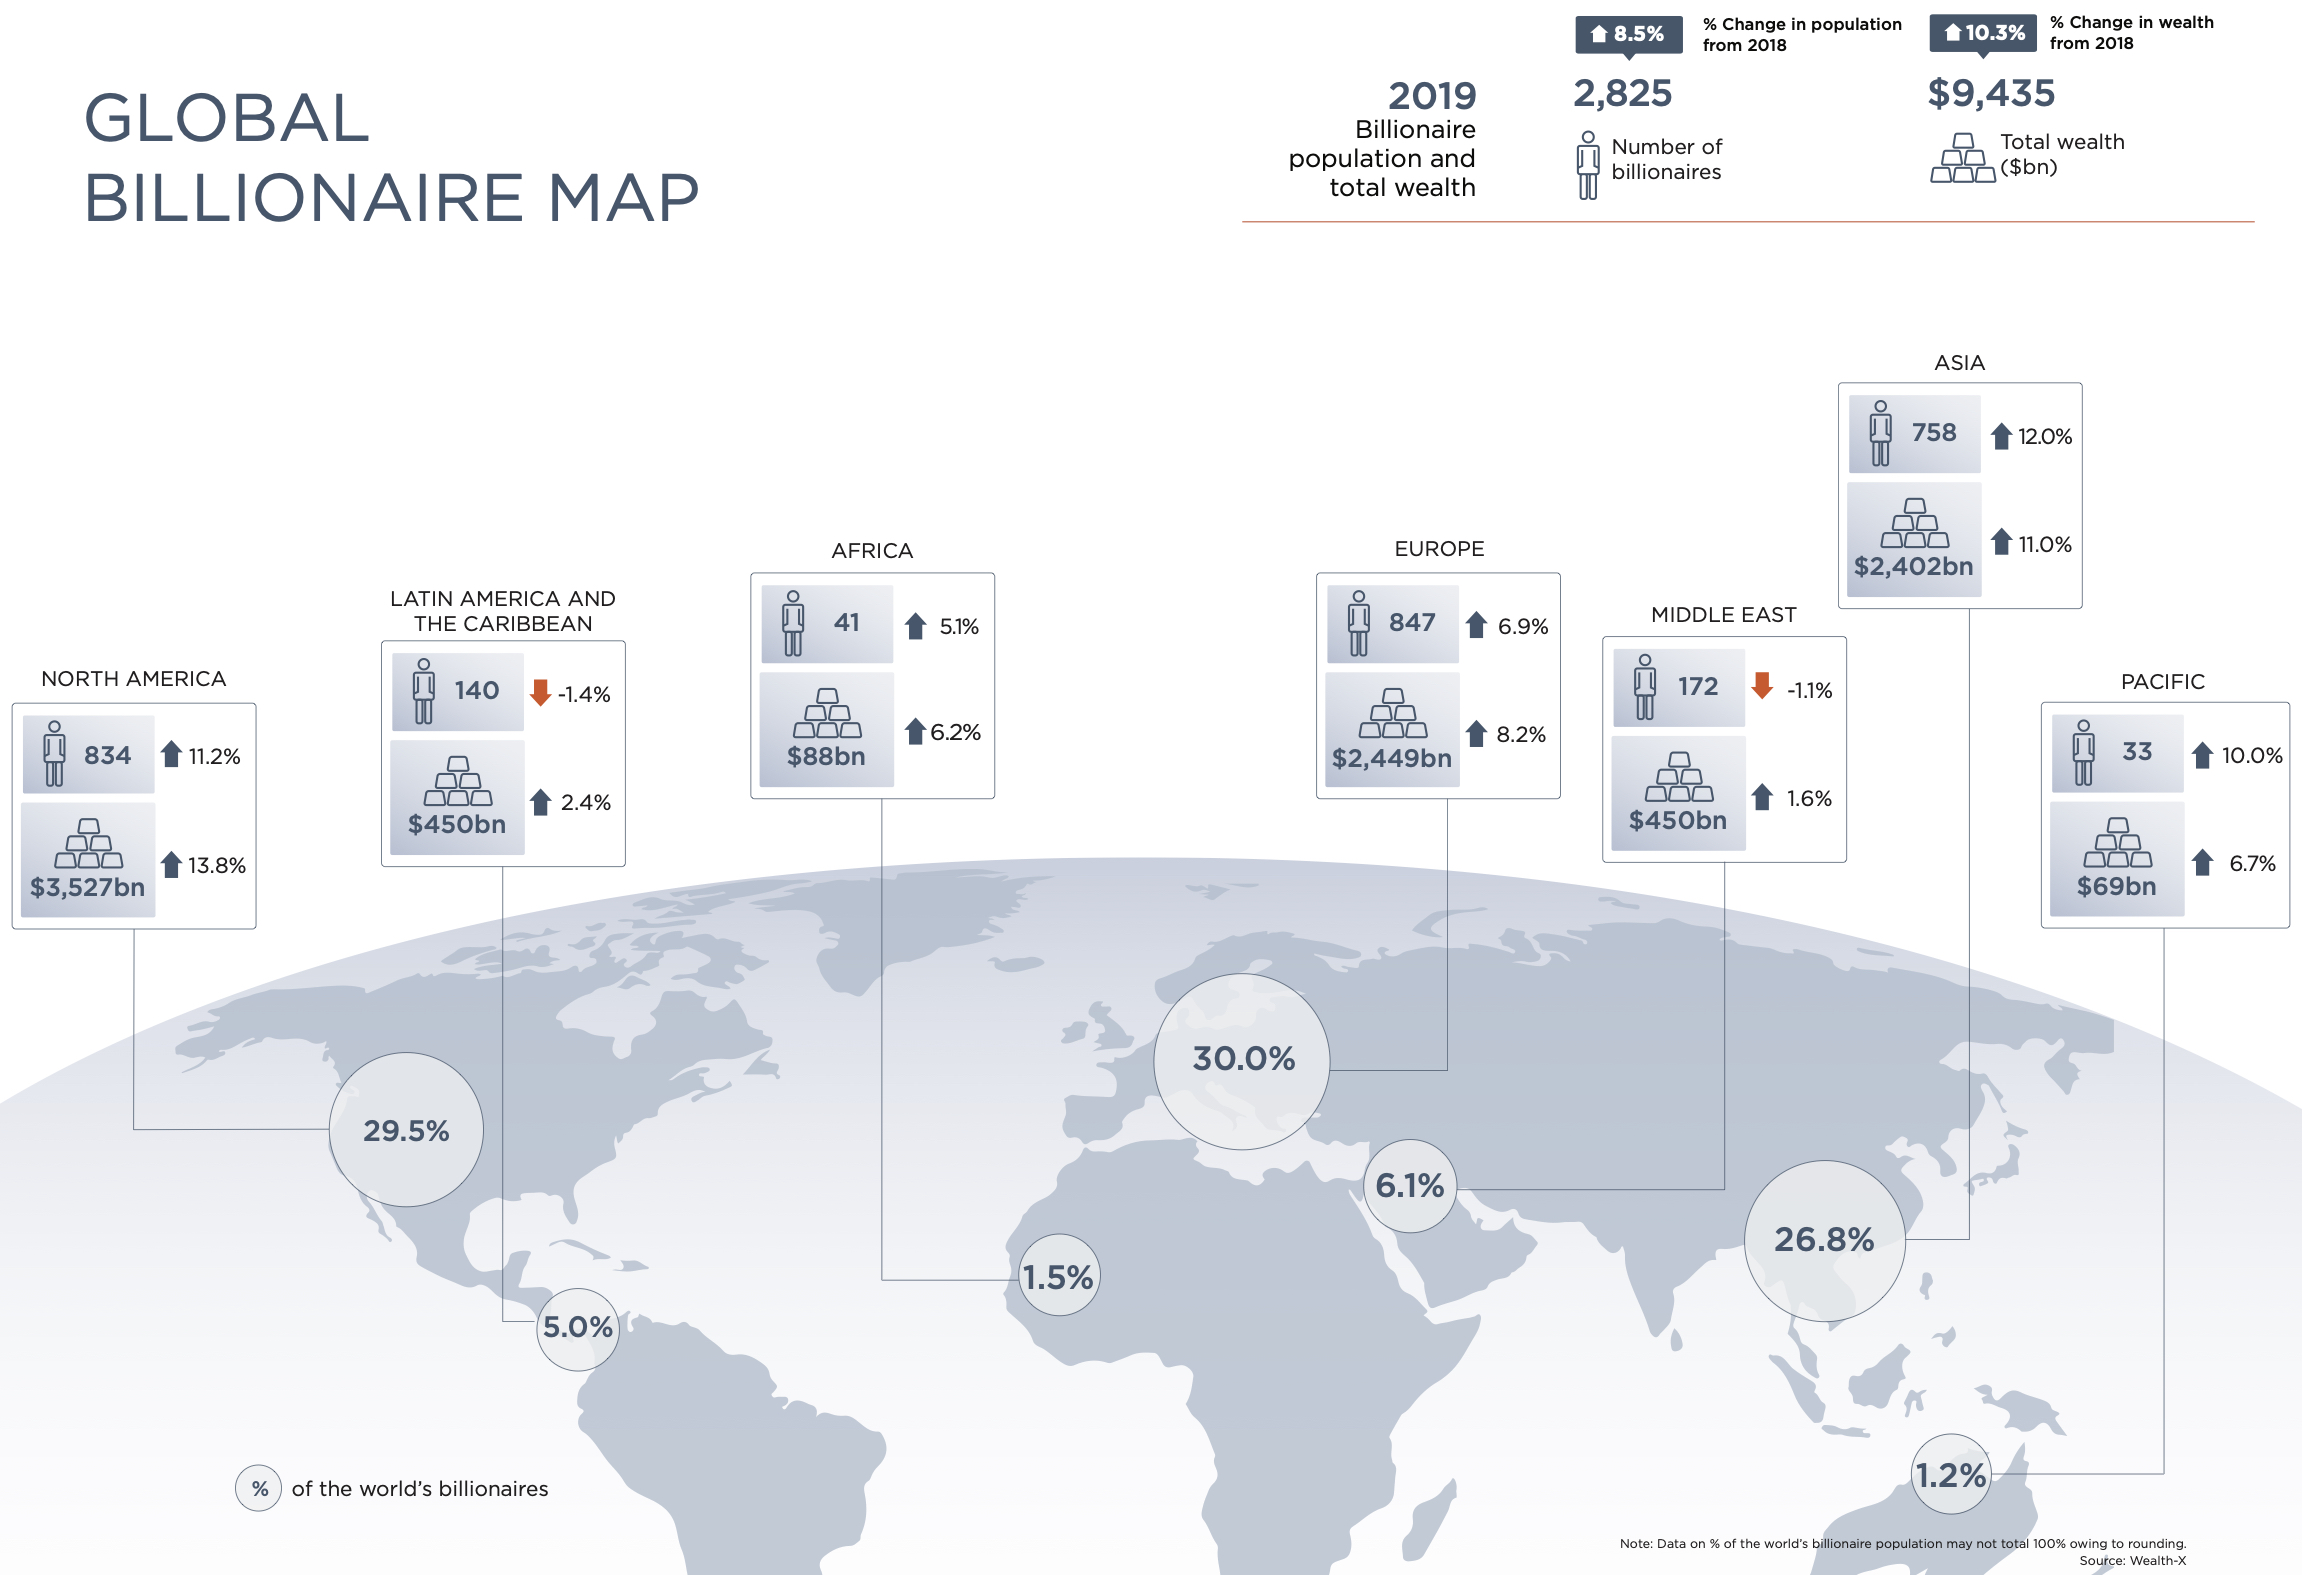
According to Wealth-X, which claims to “have developed the world’s most extensive collection of records on wealthy individuals and produce unparalleled data analysis to help our clients uncover, understand, and engage their target audience,  as well as mitigate risk,” the size of the global billionaire population increased strongly in 2019, rising by 8.5 percent
to 2,825 individuals, while their combined wealth increased by 10.3 percent to $9.4 trillion.

To put that into perspective, the world’s real Gross Domestic Product grew by only 2.9 percent (International Monetary Fund) in 2019—while the value of global equities, which is key to billionaires’ wealth, soared by more than 25 percent (MSCI World Index).

The United States still leads the list of the world’s billionaire population and their wealth. In 2019, the number of American billionaires rose by almost 12 percent to 788 individuals, accounting for 28 percent of the global billionaire population (China has the next highest share at 12 percent). Cumulative billionaire wealth in the United States increased by 14 percent to $3.4 trillion, more than the combined net worth of the next eight highest-ranked countries and equivalent to a 36 percent share of global billionaire wealth.*

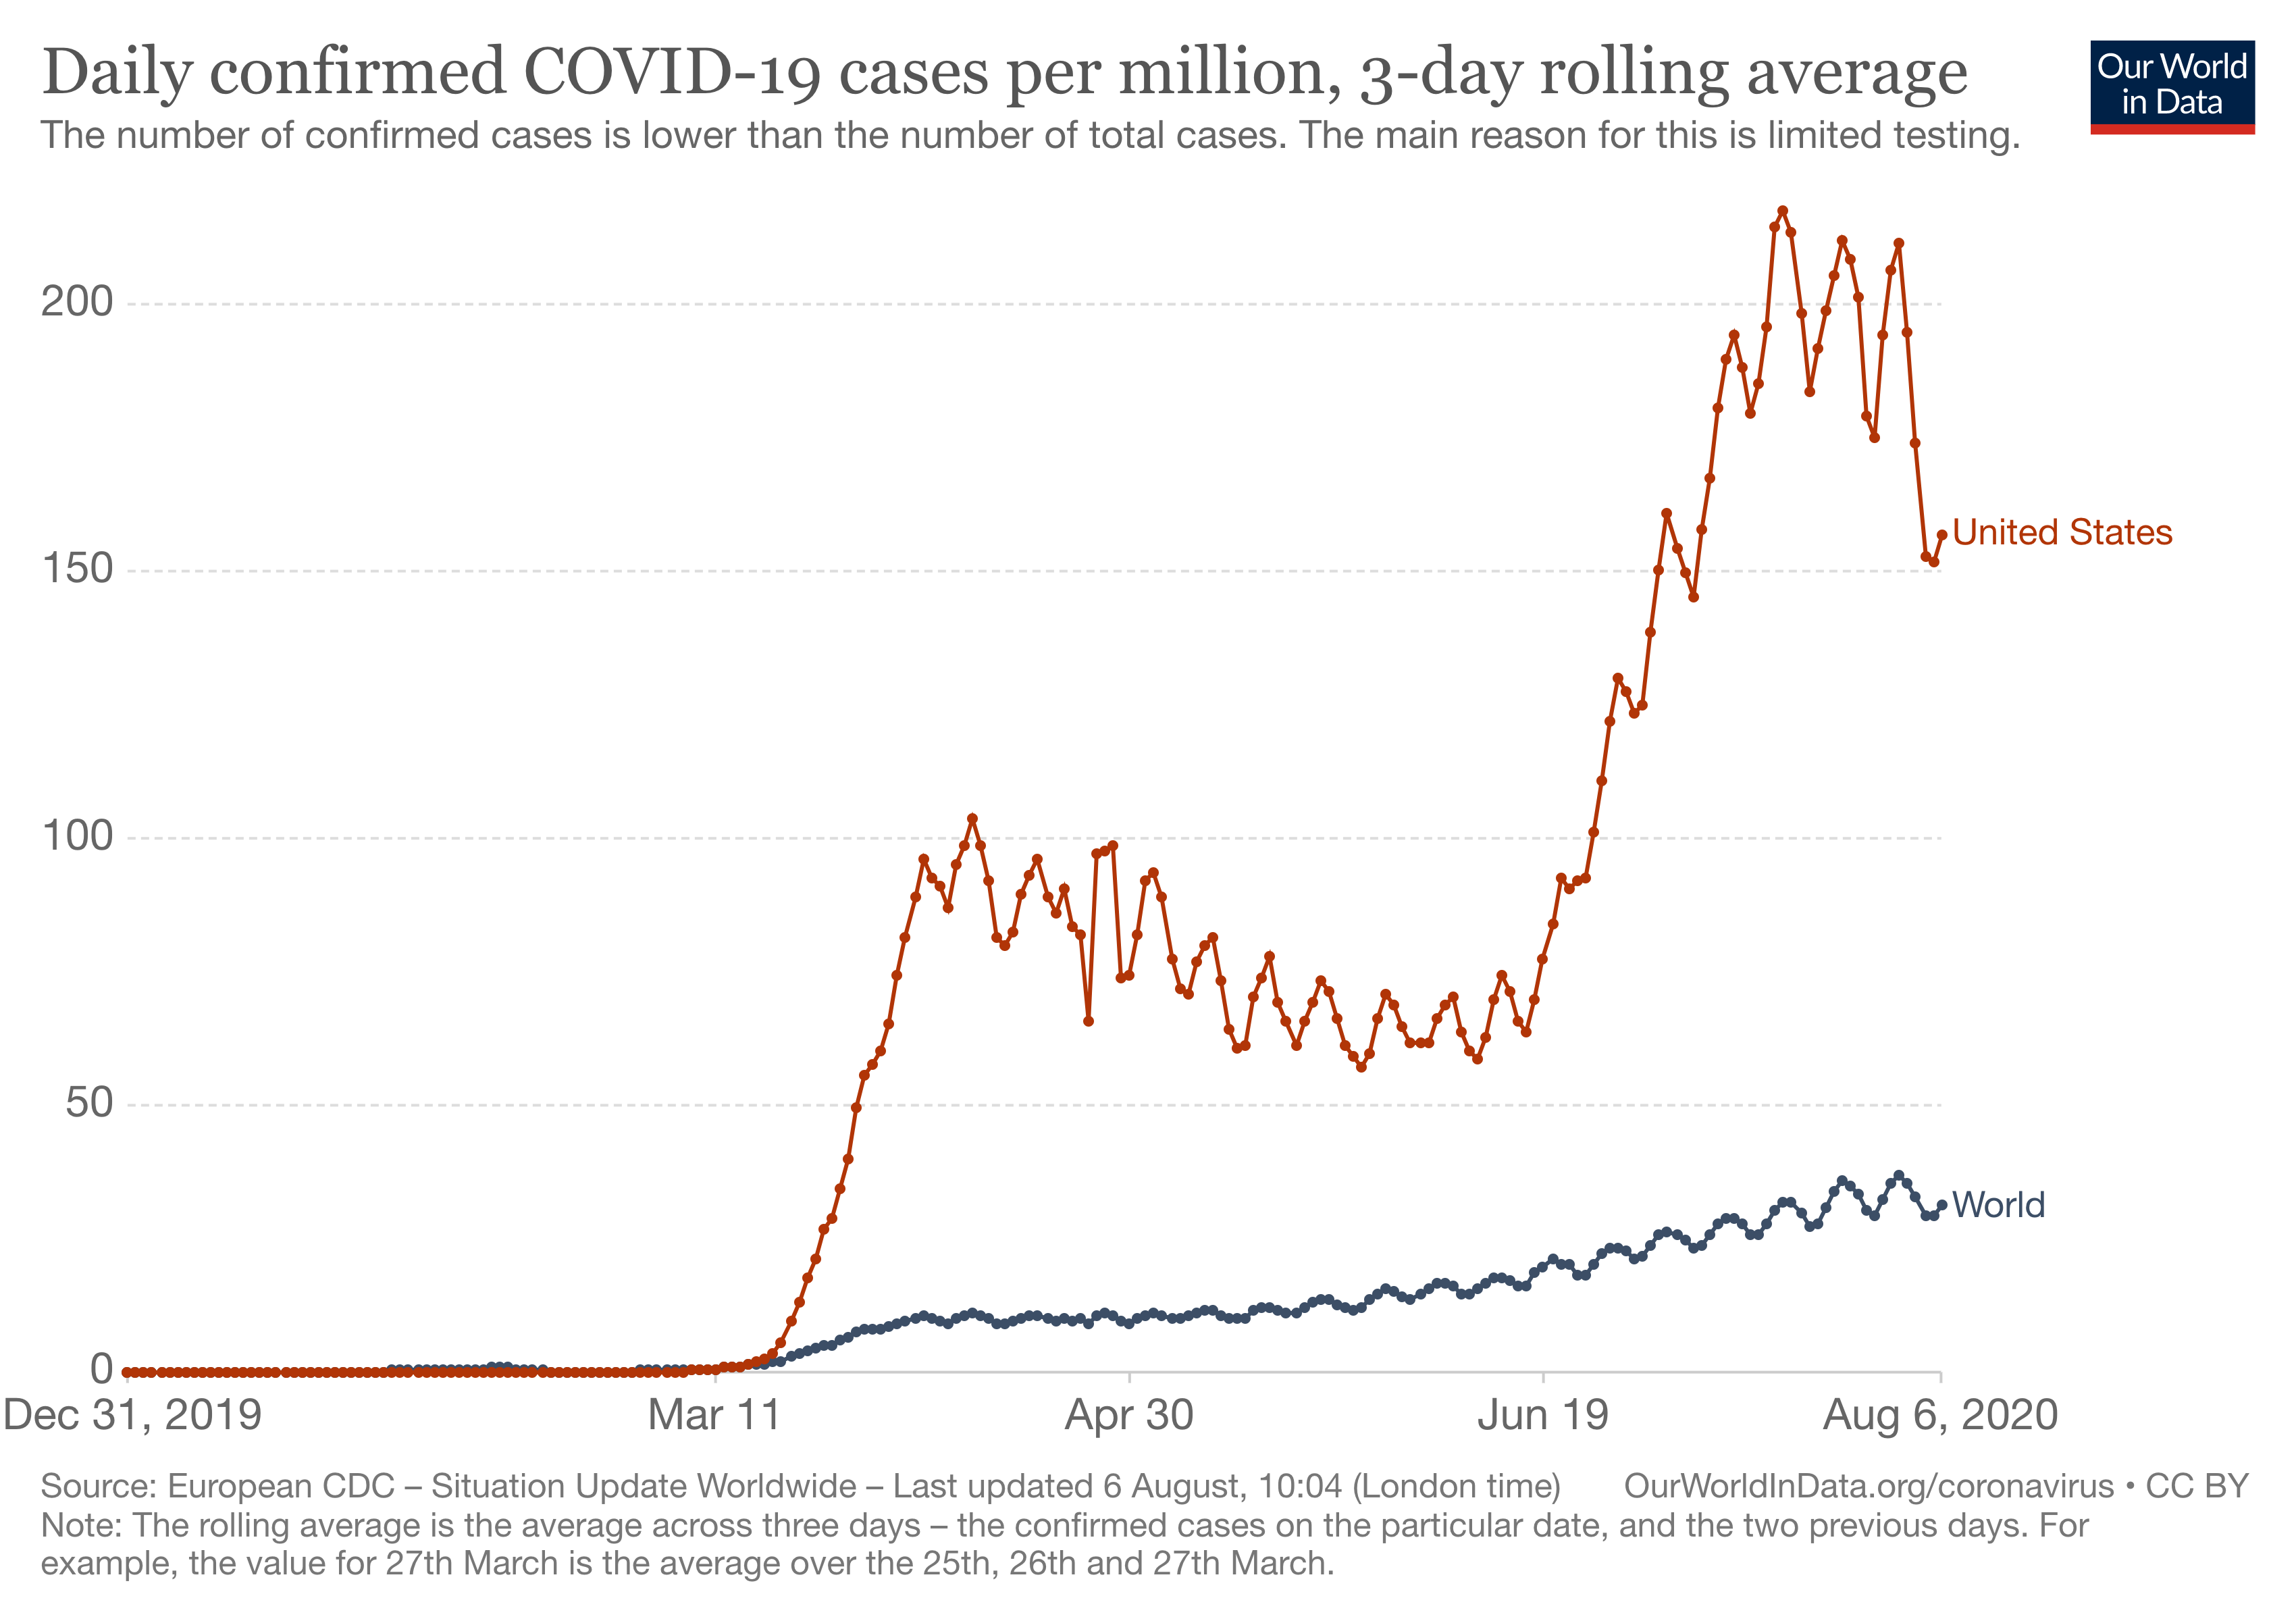
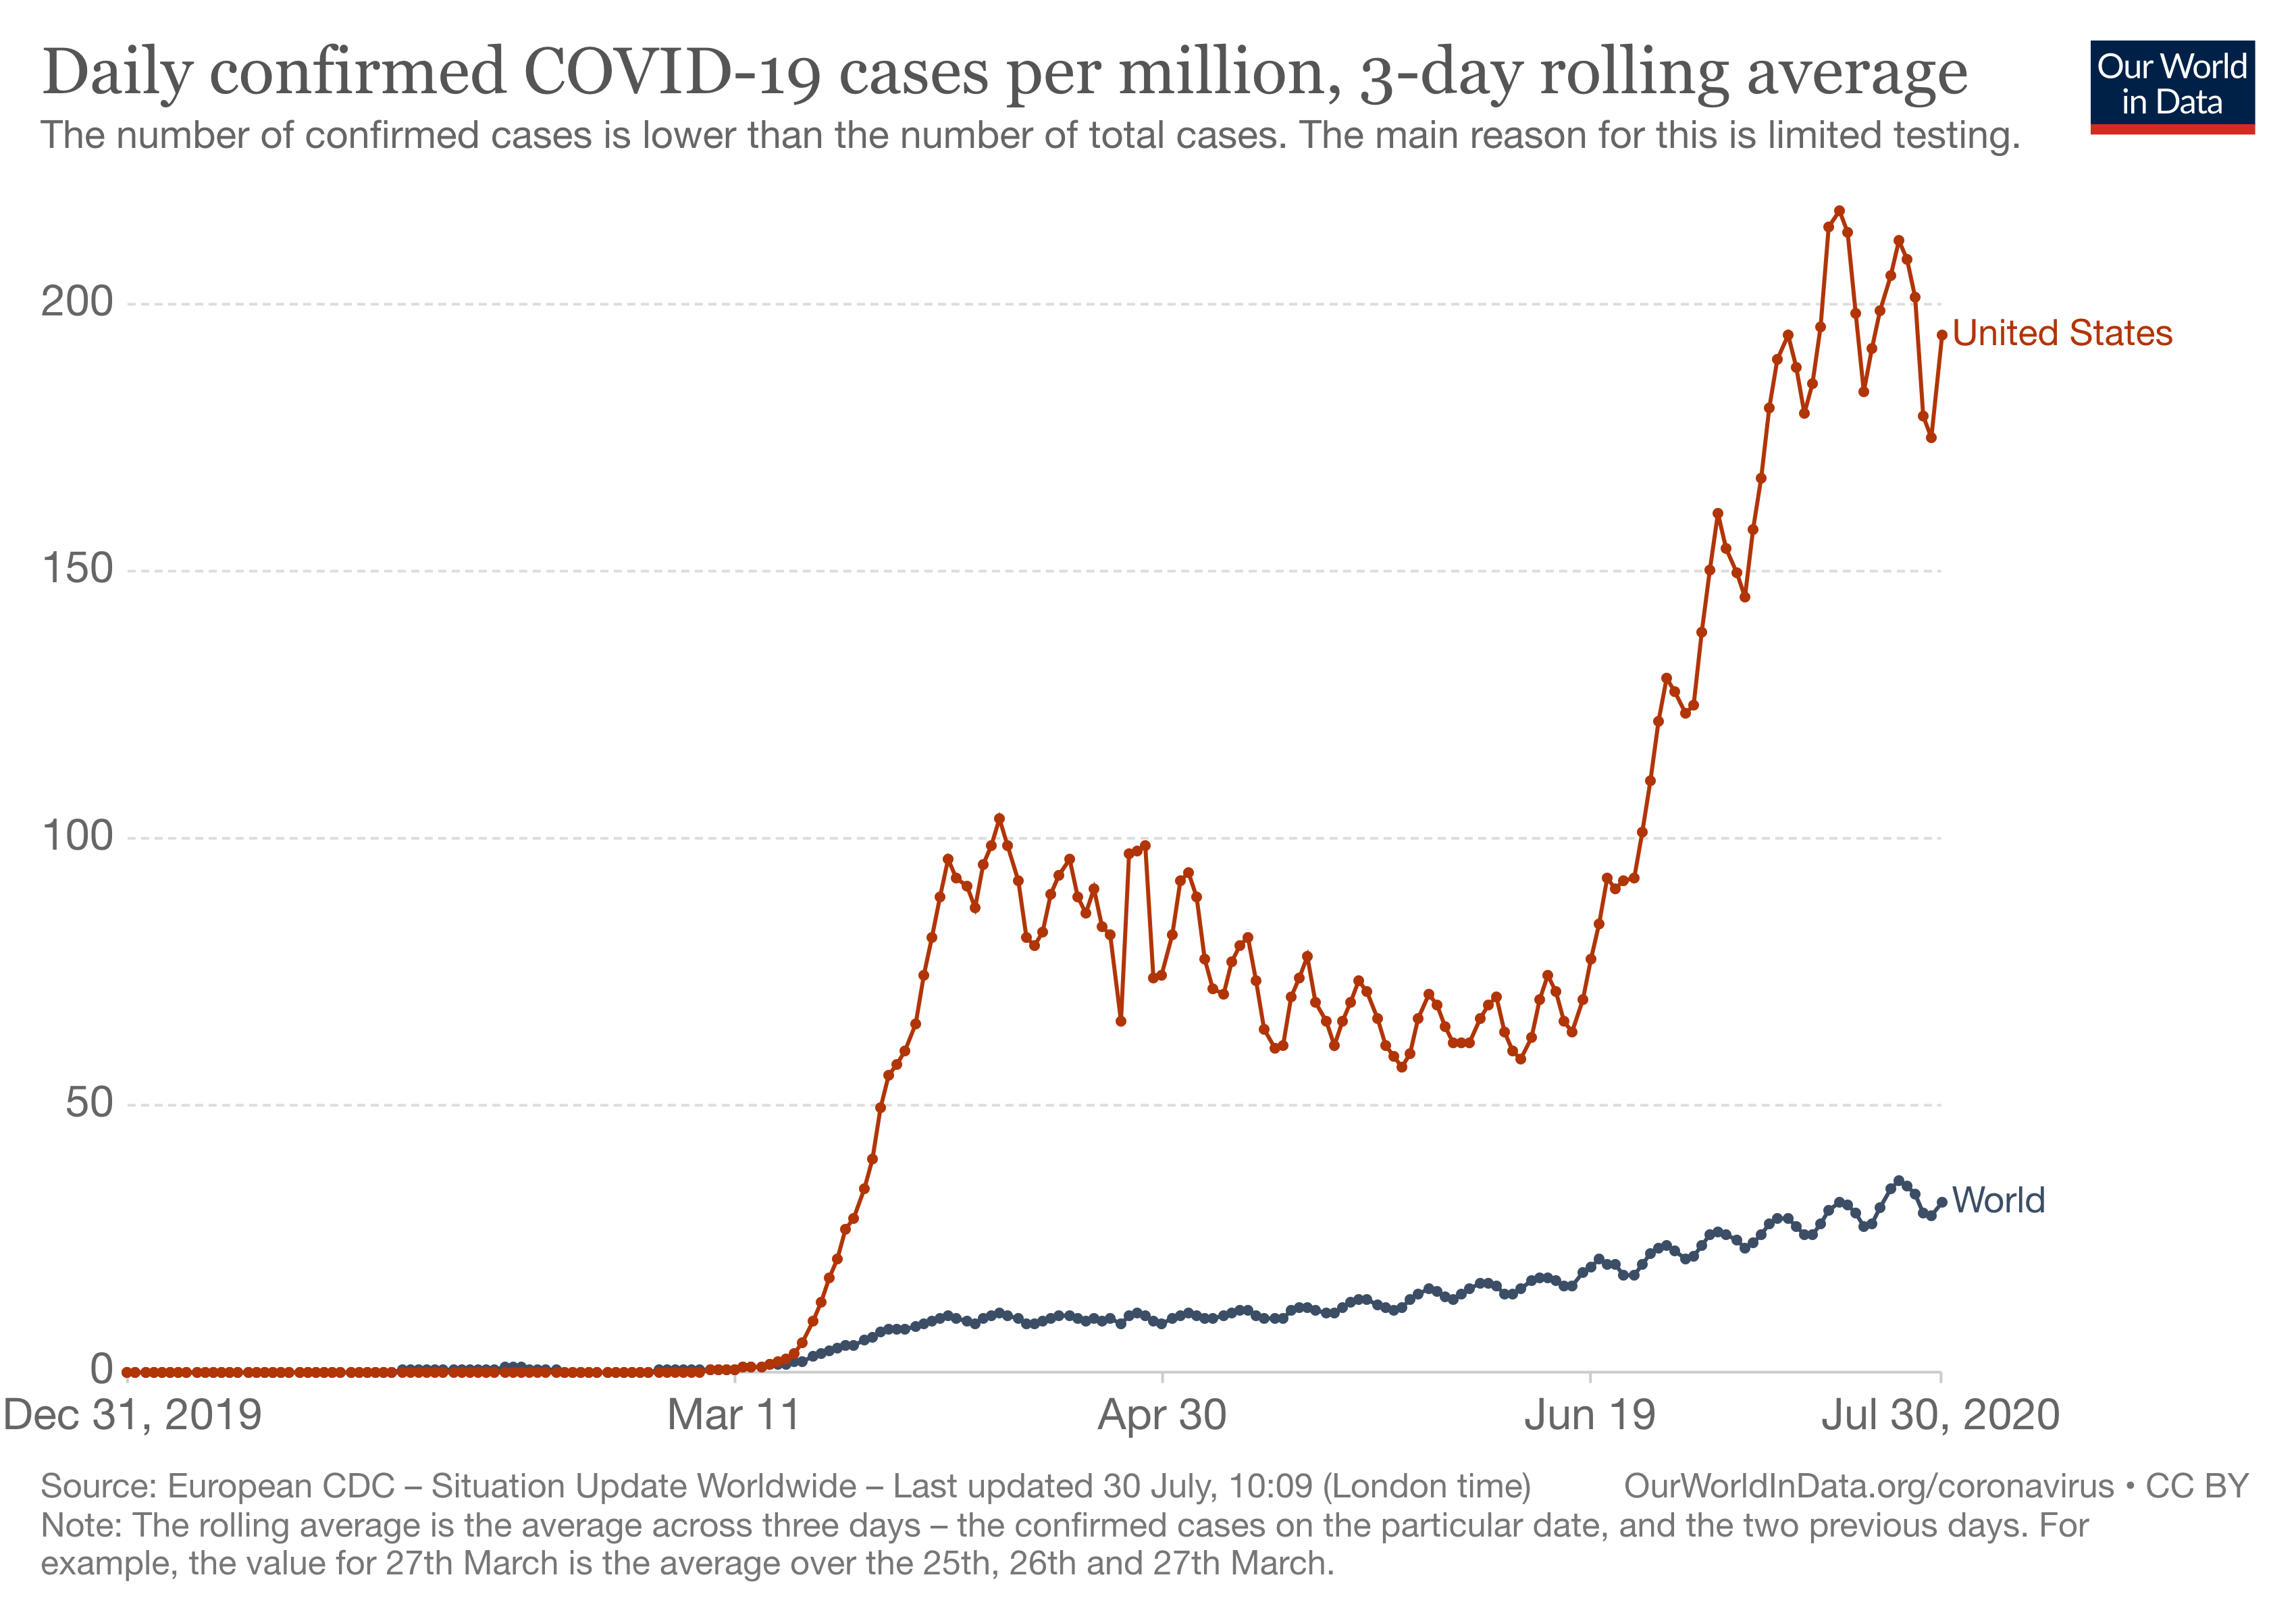
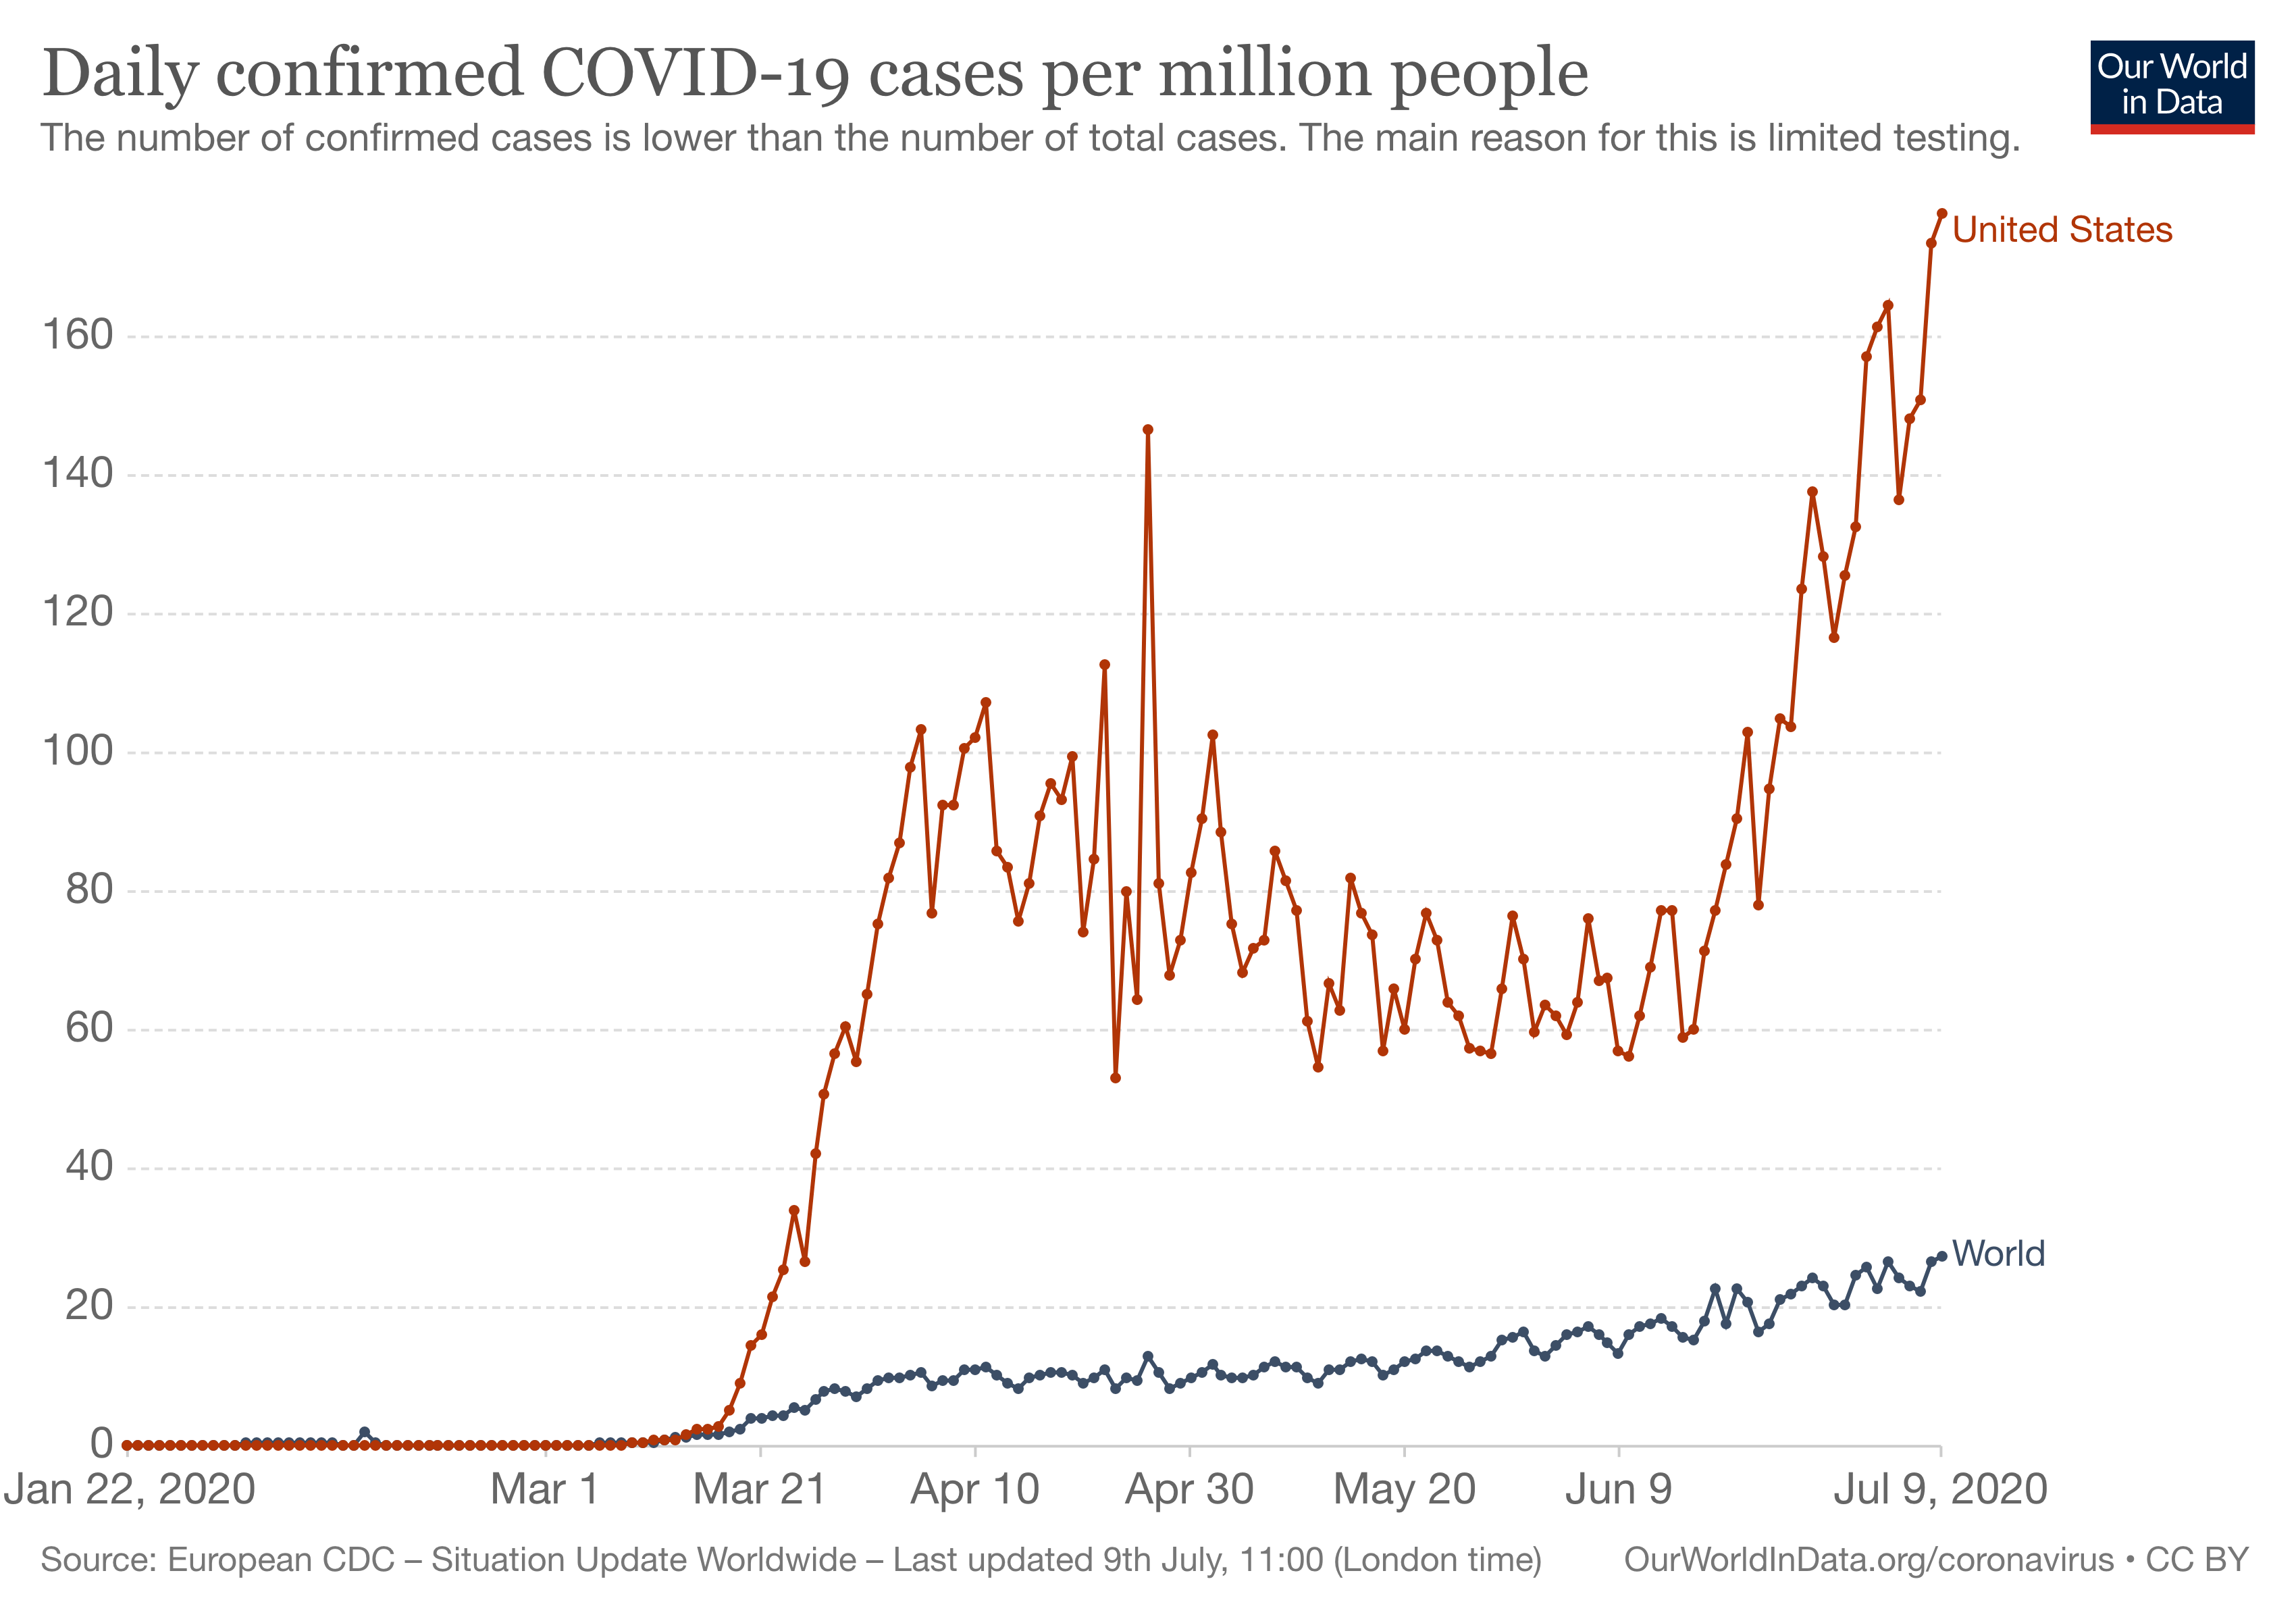
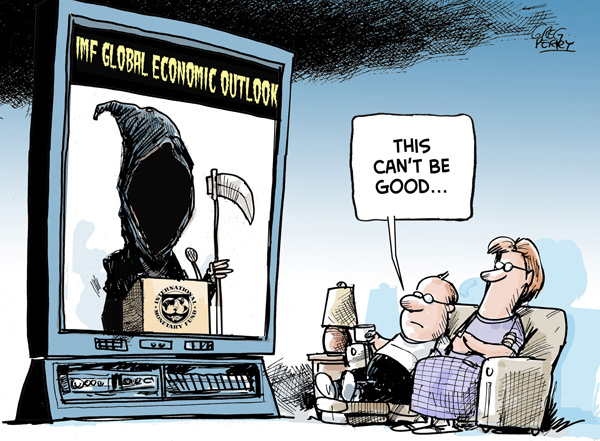
What about the novel coronavirus pandemic?

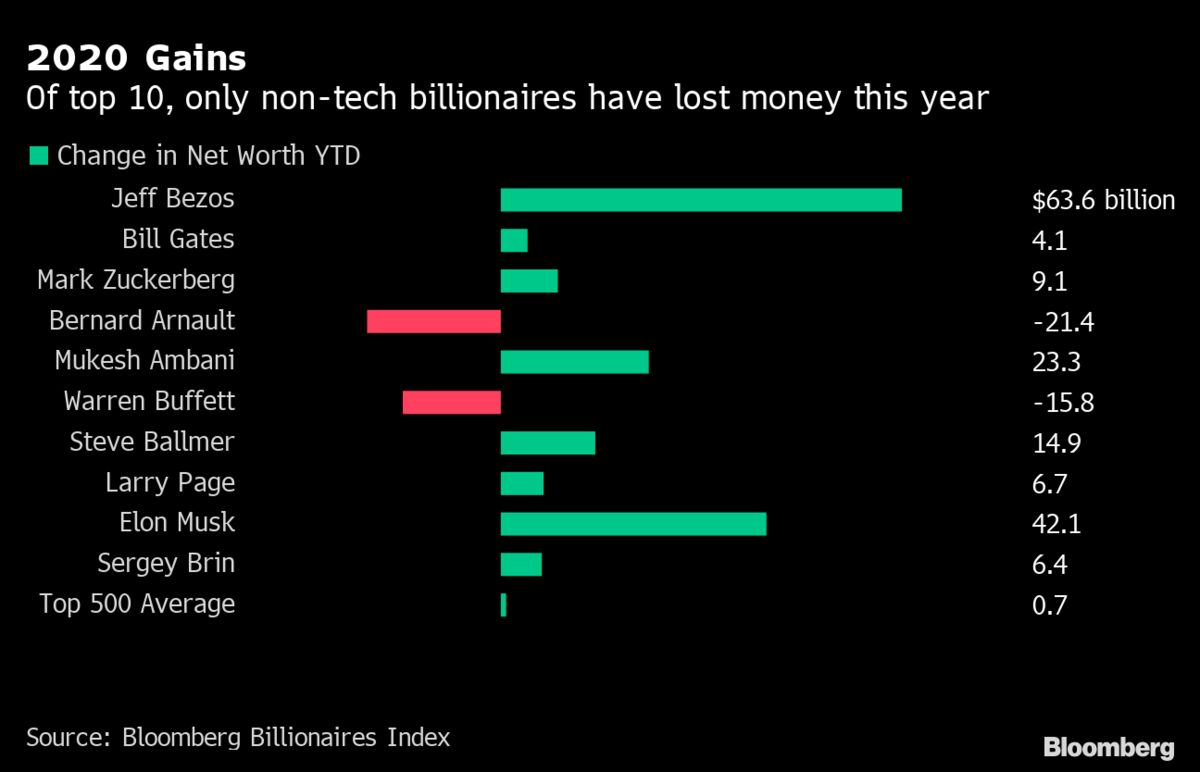
According to Bloomberg, only two of the world’s 10 richest people have seen their wealth decline in 2020: luxury mogul Bernard Arnault and Berkshire Hathaway Inc.’s Warren Buffett. Everyone else, whose wealth is tied to technology holdings (except for Mukesh Ambani, the Indian billionaire who chairs and runs oil and gas giant Reliance Industries), has seen their individual and collective wealth increase—none more so than Jeff Bezos (the Amazon.com Inc. founder who has seen his net worth soar by $63.6 billion this year) and Elon Musk (whose net worth has more than doubled to $69.7 billion on the back of surging Tesla Inc shares).**

On a global level, billionaires tied to technology businesses have outperformed all others, especially those whose wealth is tied to the automotive, shipping, media, textiles and apparel, and aerospace (less so defense) industries. They, of course, are the ones who most want to see a quick solution to the pandemic and a reopening of economic activity around the world.

In general terms, wealthier billionaires are more exposed to the ebbs and flows of the stock market, while those at lower tiers tend to have more of their wealth in private holdings, likely to be their primary business. For example, those in the two highest billionaire wealth tiers—above $10 billion— hold between almost half and more than three-quarters of their assets in public holdings. These individuals have withstood significant volatility in their wealth as stock markets first fell considerably and then rebounded equally dramatically—this past Friday, to a new record high in the United States—since the beginning of the pandemic.

So, what are the world’s billionaires, in the United States and around the globe, doing with their wealth in the midst of the pandemic? We know they’re not particularly worried with the same problems as their predecessors, the Robber Barons, whose enormous economic power in the United States created a fierce counter-reaction, in militant labor unrest and the adoption of reforms that once seemed radical, like the Sherman Antitrust Act and a federal income tax.

At least so far. . .

Instead, according to Wealth-X, they are

working with their wealth advisors and planners to ensure their financial holdings and wealth plans (whether concerned with investment diversification, wealth transfer or philanthropic aims) remain up to date and in the best possible state given the evolving global situation.

They’re also concerned about their own safety and new forms of luxury consumption. According to the Wealth-X Global Luxury Outlook 2020. “The wealthy’s mindset around what luxury is has changed—their priorities have shifted towards their families,” Jaclyn Sienna India, CEO of luxury travel company Sienna Charles, said in the report. “Luxury now includes a second passport, access to healthcare and the freedom to go when and where they feel safe and secure.”

“Quite a few wealthy people are looking for exclusive safe havens in the form of second homes—safety has become a priority for them,” Alistair Brown, CEO of Alistair Brown International Real Estate. “But with this purchase, they expect access to established locations often via residency and additional passports as well as access to medical help.”

Additionally, the wealthy have become increasingly accustomed to purchasing luxury goods online since the pandemic, as high-end brands expand their digital offerings, the report said.

“The wealthy continue to value luxury as they did prior to Covid-19. However, the way they buy luxury has changed, with more having moved to making their purchases online,” Winston Chesterfield, principal of luxury watch company Barton.

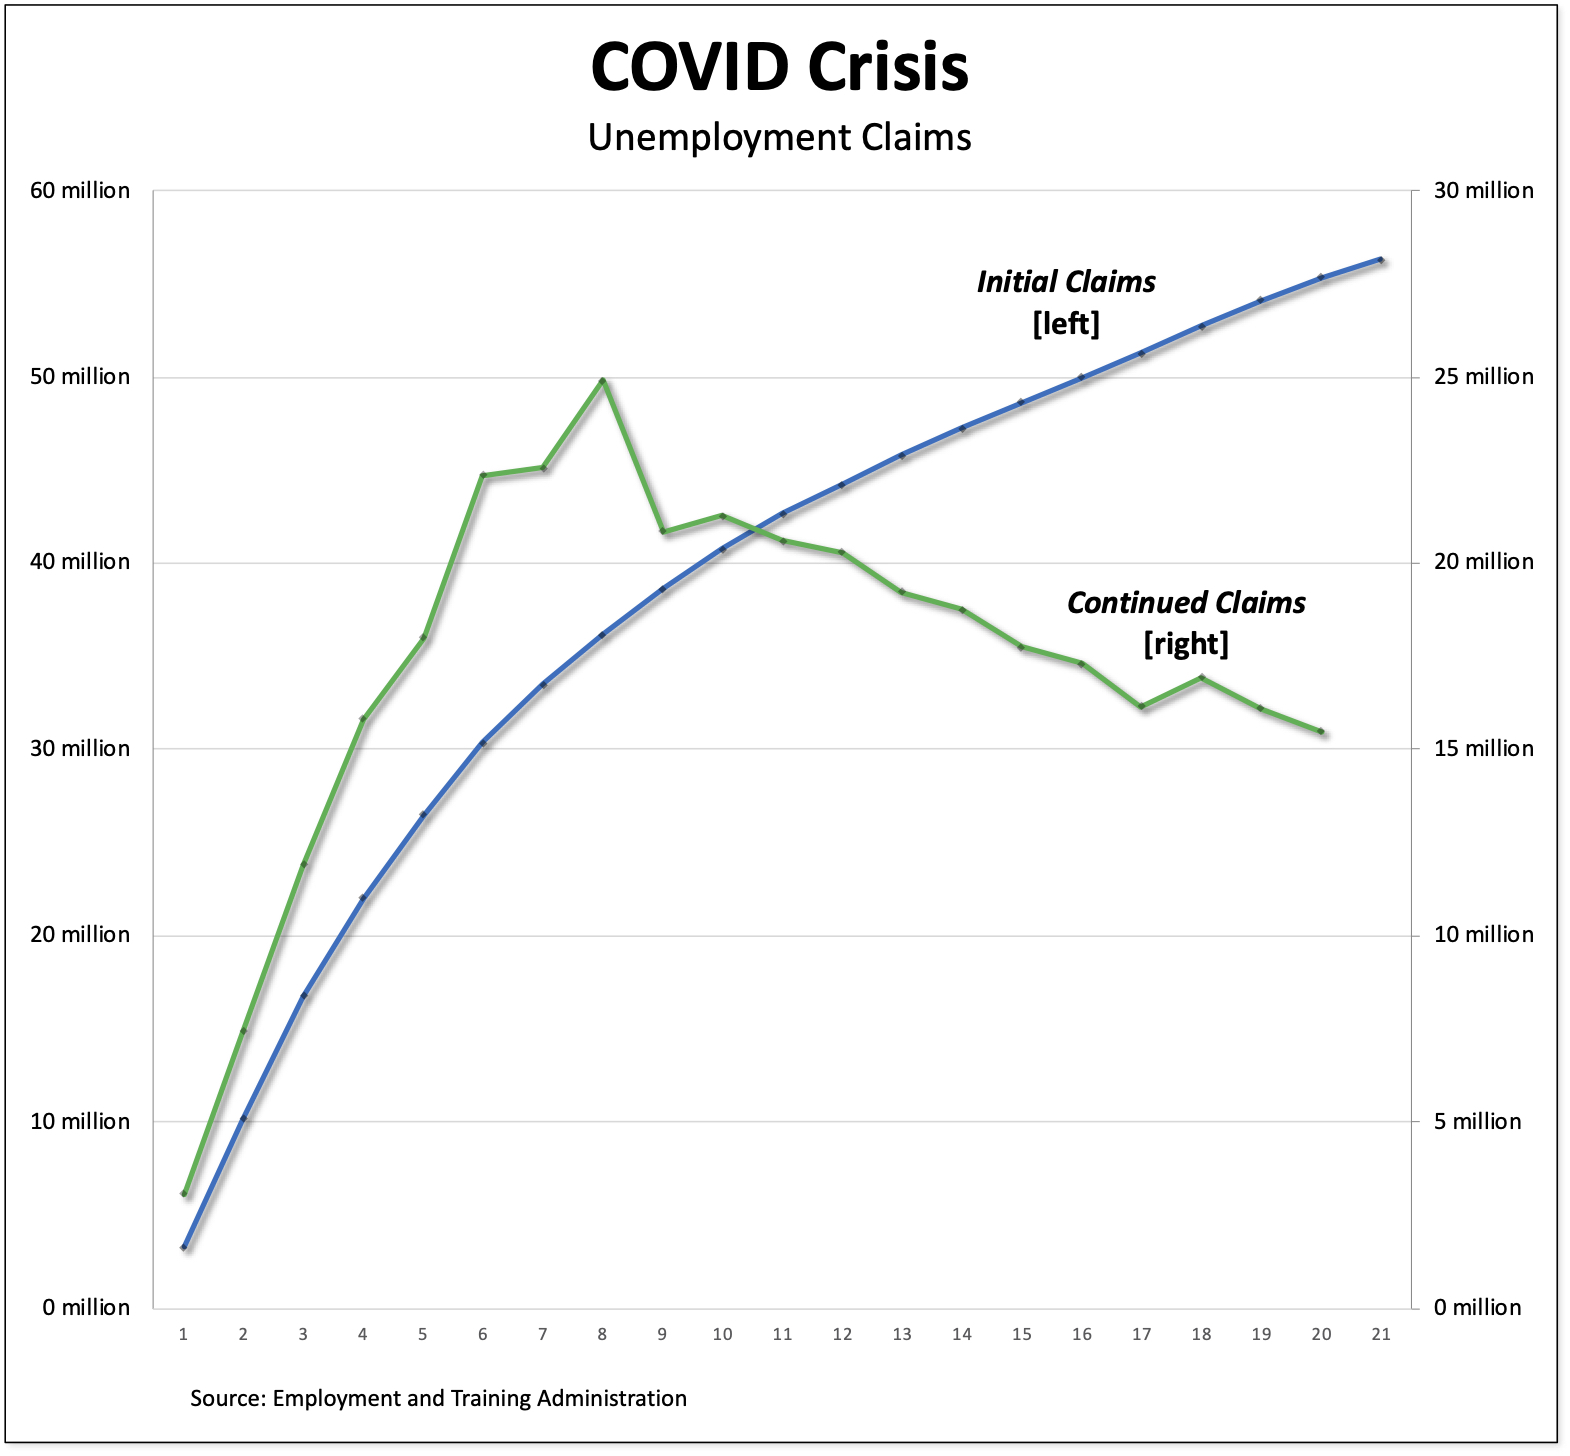
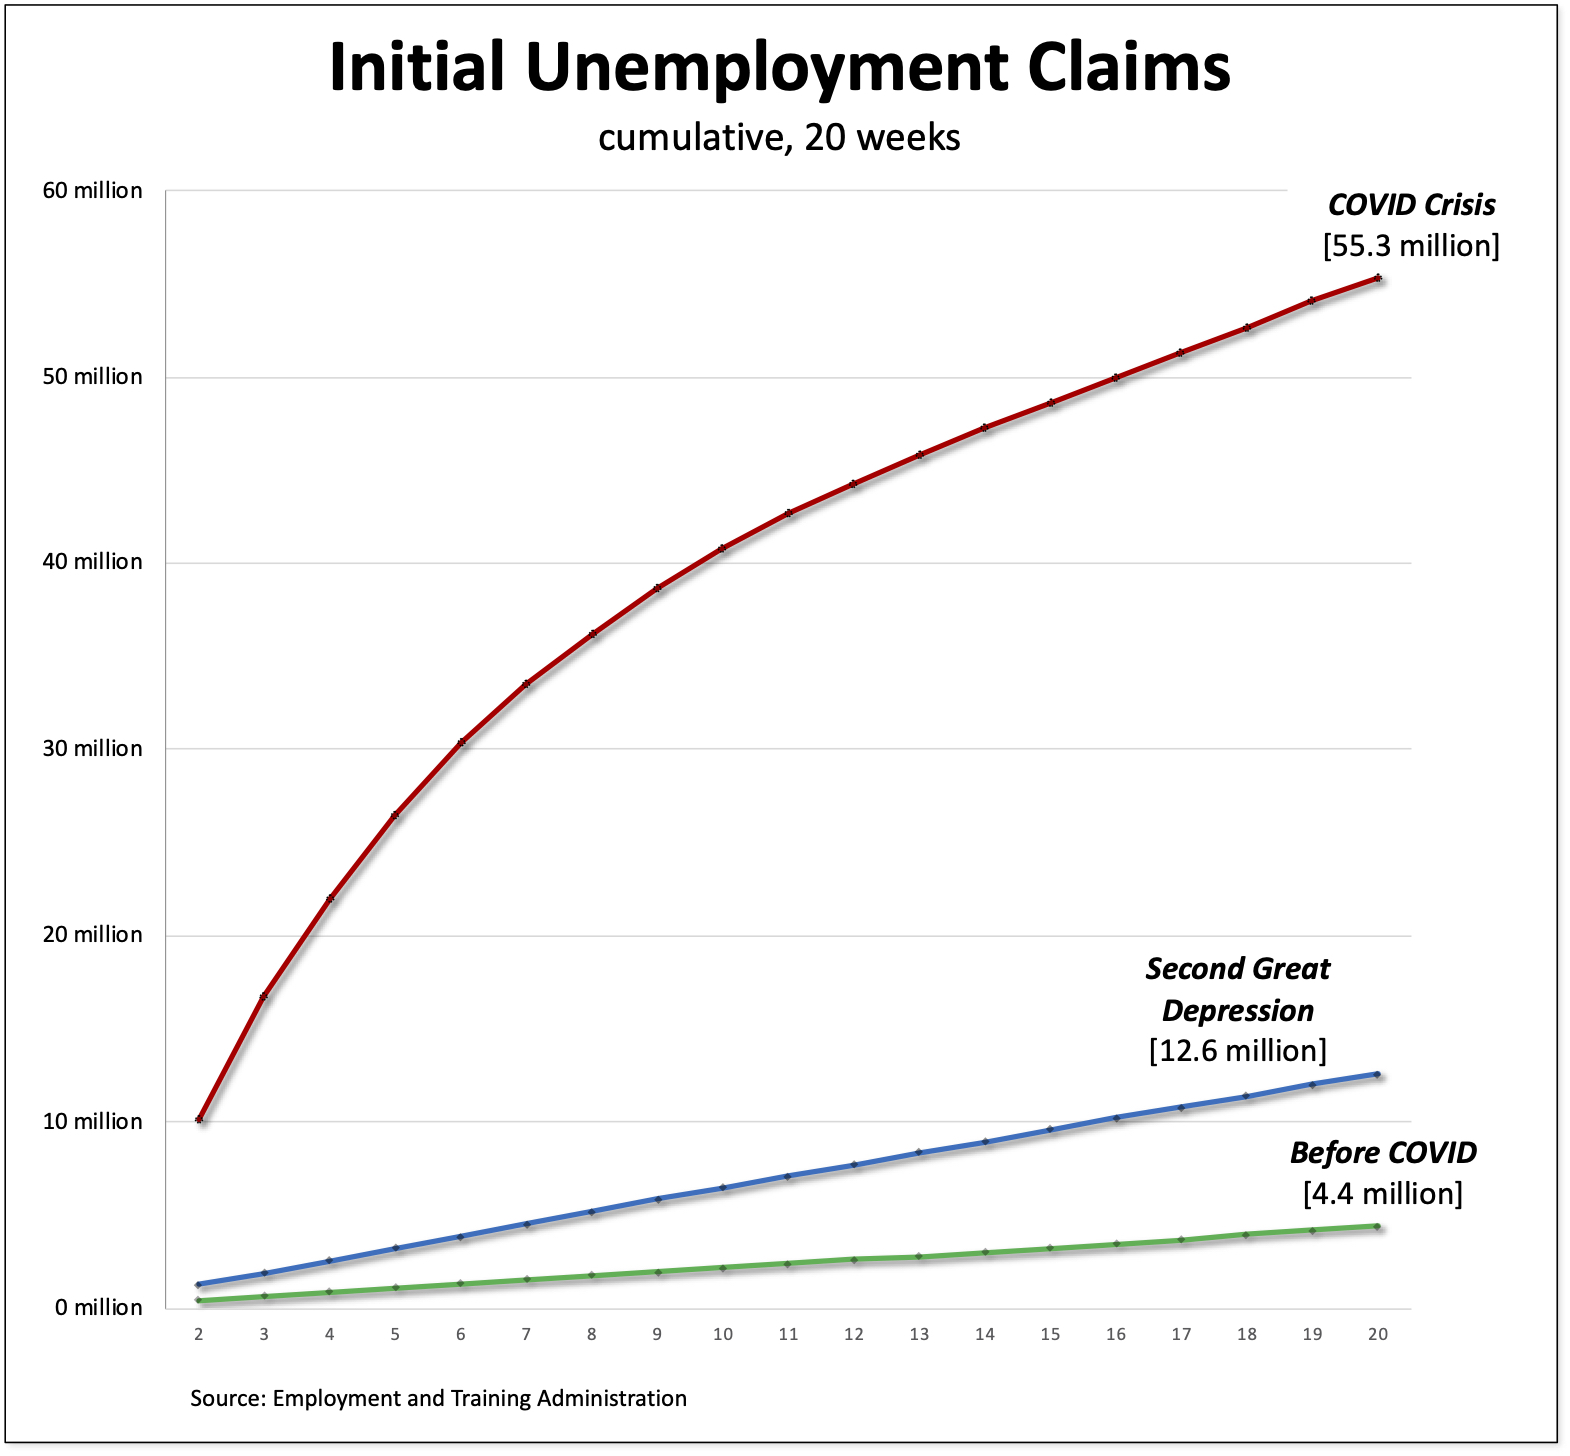
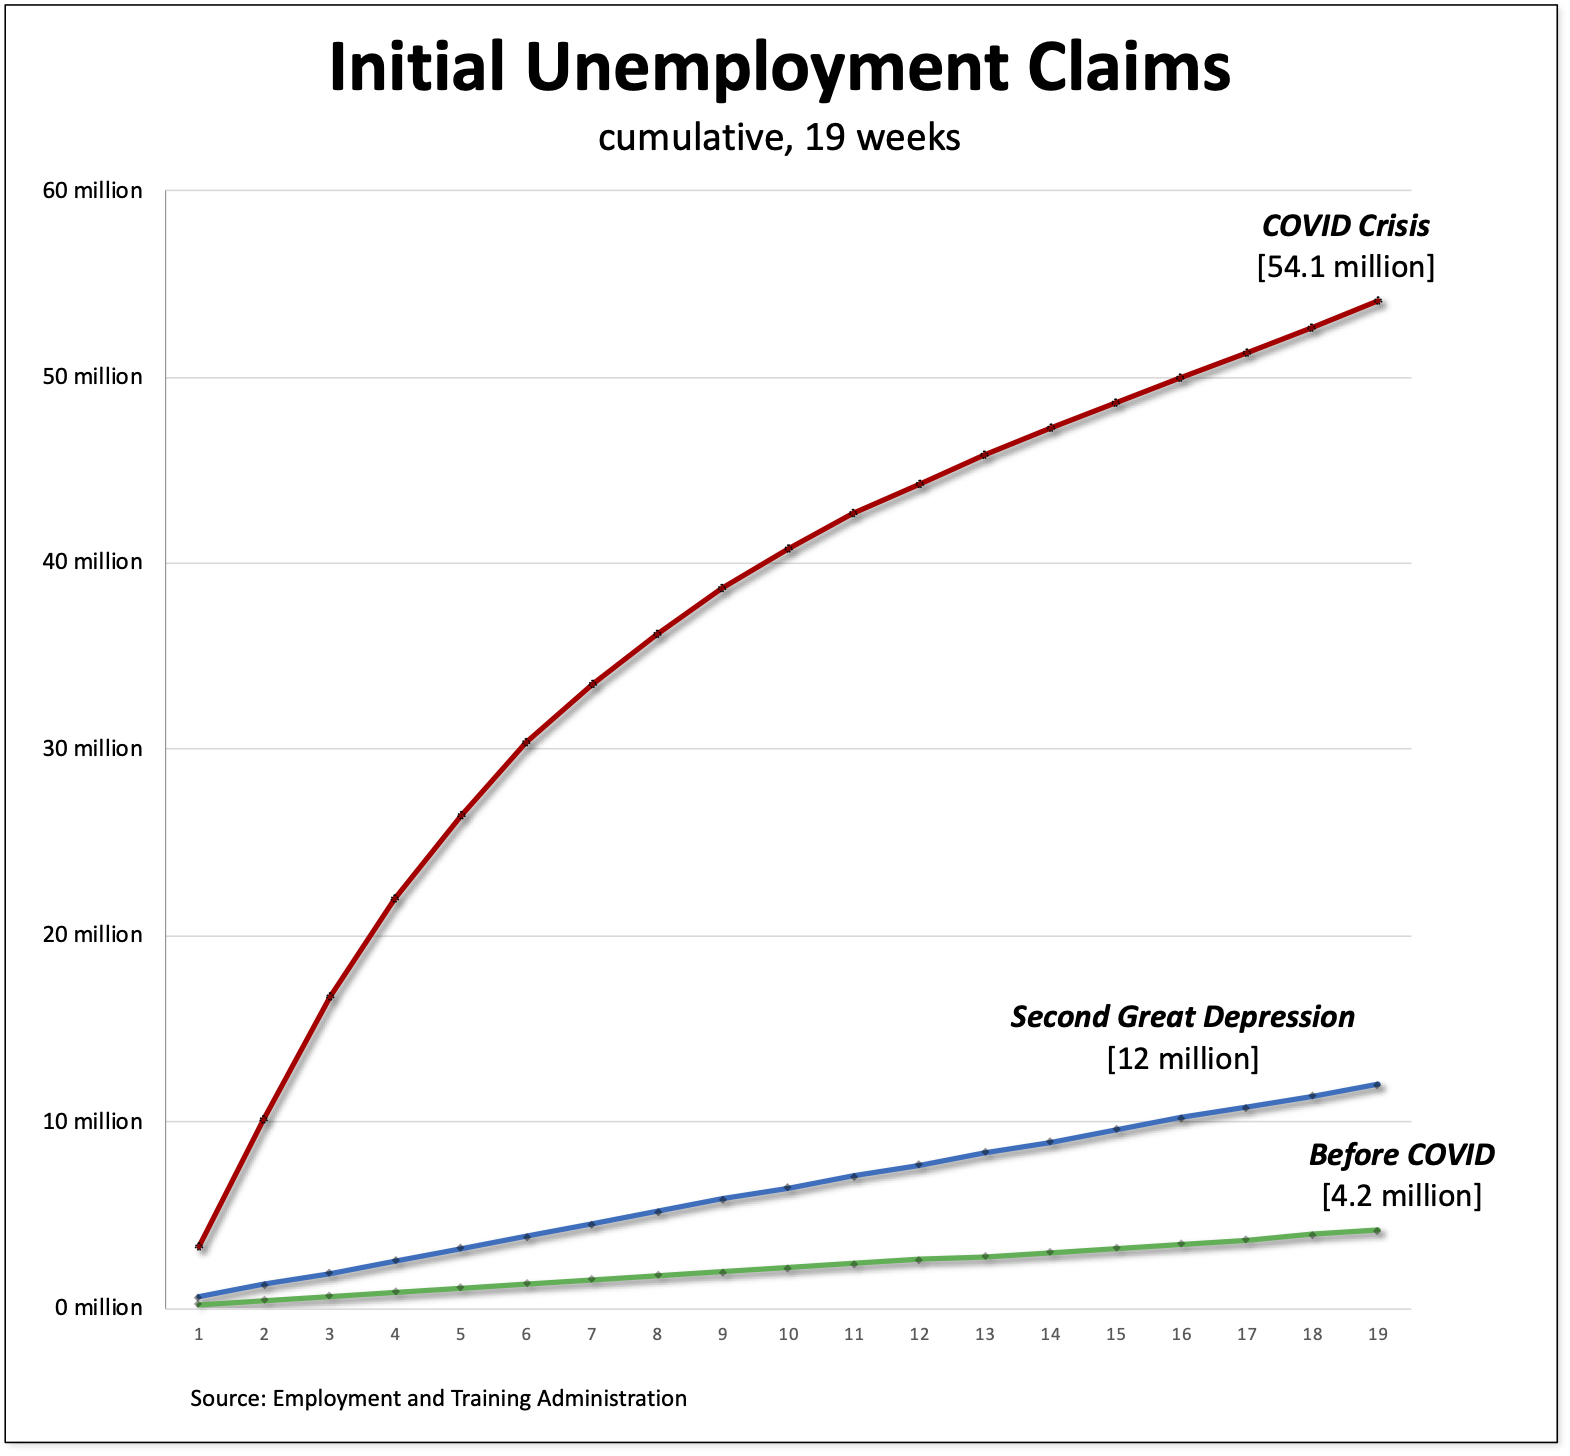
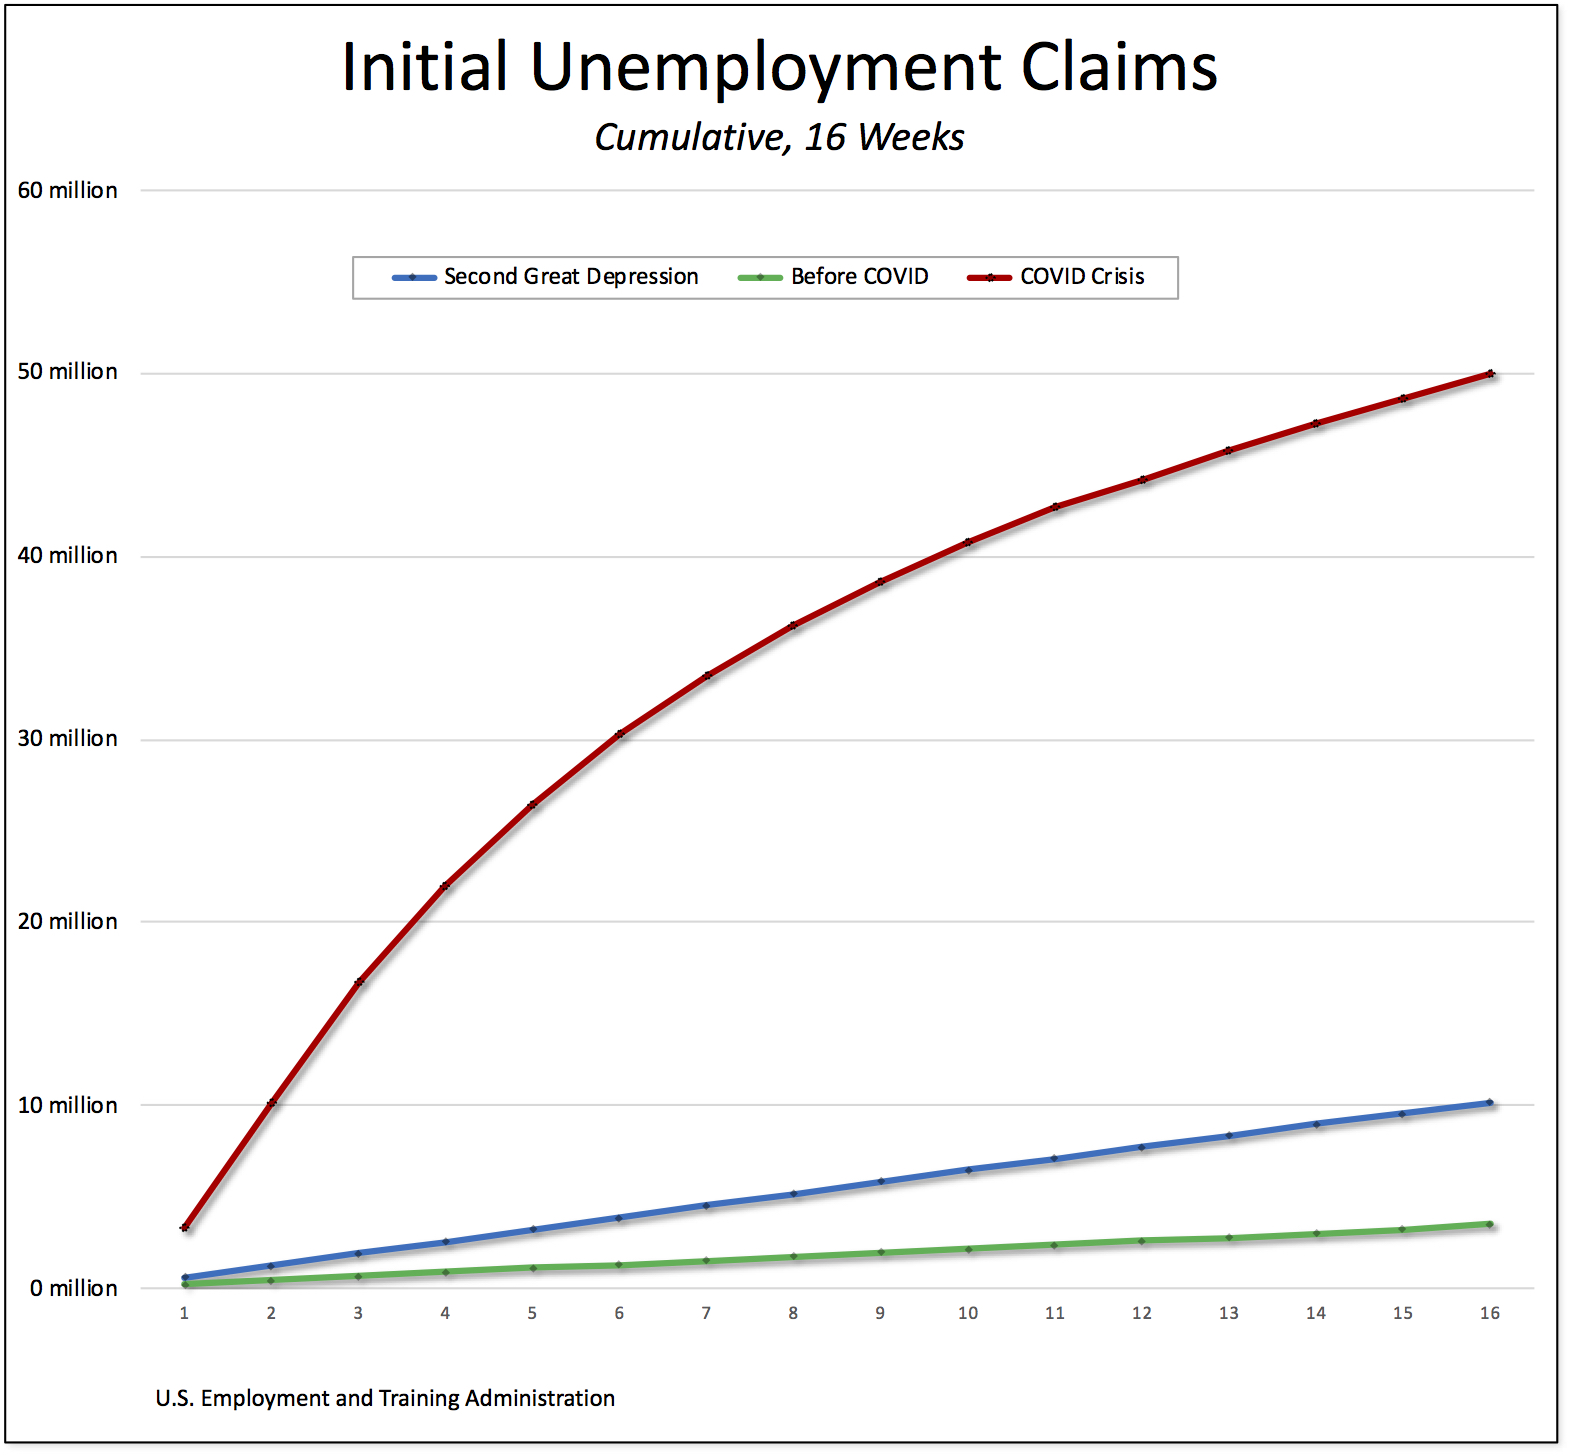
Meanwhile, what is everyone else supposed to do? Well, they have to stay as safe as they can at home and on the job—as they are subjected to the second or third wave of the pandemic—and try to obtain sufficient food, remain in their shelter while not being able to keep up with their rents and mortgages, and pay for their healthcare—in the midst of widespread pay cuts and soaring unemployment.

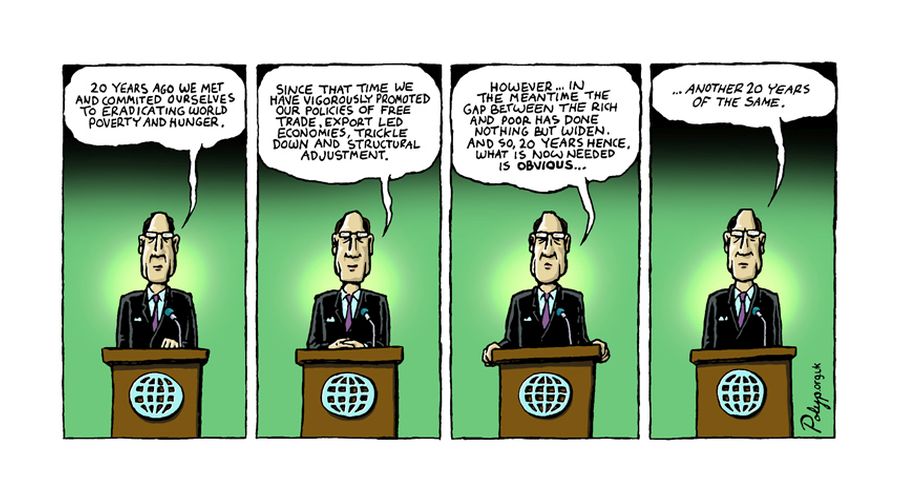
And, perhaps, begin to sharpen the twenty-first century equivalent of pitchforks. . .

———

*That’s my quick (and, I understand, overly simplistic) argument against the rise of fascism in the United States: billionaires and the other members of the group of ultra-wealthy individuals don’t need it, since they’re doing quite well the way things are.

**Currently, five of the largest American tech companies—Apple, Amazon, Alphabet, Facebook, and Microsoft—have market valuations equivalent to about 30 percent of U.S. gross domestic product. That’s almost double what they were at the end of 2018.

COVID claims

The number of initial unemployment claims for unemployment compensation in the United States fell below one million for the first time since the beginning of the COVID crisis. But the cumulative number of initial claims is still staggering, reaching 56.3 million workers by the end of last week.

This morning, the U.S. Department of Labor (pdf) reported that, during the week ending last Saturday, another 963 thousand American workers filed initial claims for unemployment compensation. They’re the second group to file for unemployment claims during the pandemic who are not going to rise the additional $600 benefit that was authorized in the CARES Act.

Here is a breakdown of each of the past twenty-one weeks:

• week ending on 21 March—3.31 million

• week ending on 28 March—6.87 million

• week ending on 4 April—6.62 million

• week ending on 11 April—5.24 million

• week ending on 18 April—4.44 million

• week ending on 25 April—3.87 million

• week ending on 2 May—3.18 million

• week ending on 9 May—2.69 million

• week ending on 16 May—2.45 million

• week ending on 23 May—2.12 million

• week ending on 30 May—1.90 million

• week ending on 6 June—1.57 million

• week ending on 13 June—1.54 million

• week ending on 20 June—1.48 million

• week ending on 27 June—1.41 million

• week ending on 4 July—1.31 million

• week ending on 11 July—1.31 million

• week ending on 18 July—1.42 million

• week ending on 25 July—1.44 million

• week ending on 1 August—1.19 million

• week ending on 8 August—0.96 million

While the number of continued claims for unemployment compensation has continued to fall from its peak, the total from the previous week (the series of continued claims lags initial claims by one week) was still 15.5 million workers. And we need to add to that an additional 10.7 million workers receiving Pandemic Unemployment Assistance.* Therefore, as of 10 days ago, 26.2 million workers were receiving some form of unemployment compensation.

To understand the magnitude of this figure, we need to compare it to the number of continued claims in late May 2009 (6.6 million), the worst point of the so-called Great Recession. Right now, in the midst of the Pandemic Depression, the number of American workers receiving unemployment compensation is 4 times what it was at the nadir of the Second Great Depression.

daily-covid-cases-per-million-three-day-avg

In the meantime, at least 1,478 new coronavirus deaths and 54,187 new cases were reported in the United States on 12 August. As of this afternoon, more than 5,217,000 Americans have been infected with the coronavirus and at least 166,100 have died. The three-day rolling average of new cases per million people in the country was 153.4 compared to 32.5 cases for the world as a whole.

We can therefore expect to see new waves of business closures, which in turn will mean more American workers furloughed and laid off, and therefore steady streams of both initial unemployment claims and continued claims, in the weeks and months ahead.

*This is the special program for business owners, the self-employed, independent contractors, or gig workers not receiving other unemployment insurance.

initial claims-20

The total number of initial unemployment claims for unemployment compensation in the United State continues to rise.

This morning, the U.S. Department of Labor (pdf) reported that, during the week ending last Saturday, another 1.19 million American workers filed initial claims for unemployment compensation. That means initial jobless claims exceeded one million for the twentieth week in a row.

Here is a breakdown of each week:

• week ending on 21 March—3.31 million

• week ending on 28 March—6.87 million

• week ending on 4 April—6.62 million

• week ending on 11 April—5.24 million

• week ending on 18 April—4.44 million

• week ending on 25 April—3.87 million

• week ending on 2 May—3.18 million

• week ending on 9 May—2.69 million

• week ending on 16 May—2.45 million

• week ending on 23 May—2.12 million

• week ending on 30 May—1.90 million

• week ending on 6 June—1.57 million

• week ending on 13 June—1.54 million

• week ending on 20 June—1.48 million

• week ending on 27 June—1.41 million

• week ending on 4 July—1.31 million

• week ending on 11 July—1.31 million

• week ending on 18 July—1.42 million

• week ending on 25 July—1.44 million

• week ending on 1 August—1.19 million

All told, 55.3 million American workers have filed initial unemployment claims during the past twenty weeks.

To put that into  perspective, I produced the chart above comparing the cumulative totals of the initial unemployment claims for the current pandemic compared to two other relevant periods: the worst point of the Second Great Depression (from mid-January to late May 2009) and the weeks immediately preceding the current depression (from early November 2019 to late March 2020).

As readers can see, the differences are stunning: 12.6 million workers during the Second Great Depression, 4.4 million in the period just before the COVID crisis, and more than 55 million in the past twenty weeks.

And now that emergency federal benefits have expired, the unemployed—both continuing cases and newly laid-off workers—will not be receiving the $600-a-week supplement that helped them pay their bills through the spring and early summer.

daily-covid-cases-per-million-three-day-avg

In the meantime, at least 1,253 new coronavirus deaths and 53,726 new cases were reported in the United States. As of this morning, more than 4,832,400 Americans have been infected with the coronavirus and at least 158,500 have died. The three-day rolling average of new cases per million people in the country was 157 compared to 31 cases for the world as a whole.

We can therefore expect to see new waves of business closures, which in turn will mean more American workers furloughed and laid off, and therefore a steady stream of initial unemployment claims, in the weeks and months ahead.

As Vijay Prashad [ht: ja] has explained,

The incompetence of the Trump administration—mirroring the dangerous incompetence of Jair Bolsonaro of Brazil and Narendra Modi of India—coming on top of a destroyed public health system and a failed private sector testing establishment has condemned millions of people in the U.S. to catch the disease and pass it on. There is—thus far—no prospect of breaking the chain of infection in the United States.

initial claims-19

Initial unemployment claims in the United State continue to rise.

This morning, the U.S. Department of Labor (pdf) reported that, during the week ending last Saturday, another 1.43 million American workers filed initial claims for unemployment compensation. Last week, it was 1.42 million.

Here is a breakdown of each week:

• week ending on 21 March—3.31 million

• week ending on 28 March—6.87 million

• week ending on 4 April—6.62 million

• week ending on 11 April—5.24 million

• week ending on 18 April—4.44 million

• week ending on 25 April—3.87 million

• week ending on 2 May—3.18 million

• week ending on 9 May—2.69 million

• week ending on 16 May—2.45 million

• week ending on 23 May—2.12 million

• week ending on 30 May—1.90 million

• week ending on 6 June—1.57 million

• week ending on 13 June—1.54 million

• week ending on 20 June—1.48 million

• week ending on 27 June—1.41 million

• week ending on 4 July—1.31 million

• week ending on 11 July—1.31 million

• week ending on 18 July—1.42 million

• week ending on 25 July—1.43 million

All told, 54.1 million American workers have filed initial unemployment claims during the past nineteen weeks.

To put that into some kind of perspective, I produced the chart above comparing the cumulative totals of the initial unemployment claims for the current pandemic compared to two other relevant periods: the worst point of the Second Great Depression (from late January to late May 2009) and the weeks immediately preceding the current depression (from early November 2019 to late March 2020).

As readers can see in the chart above, the differences are stunning: 12 million workers during the Second Great Depression, 4.2 million in the period just before the COVID crisis, and more than 54 million in the past nineteen weeks.

GDP

The extraordinarily high numbers of initial claims should come as no surprise, given the decline in economic activity throughout the country. This morning, the Commerce Department reported that real Gross Domestic Product decreased at an annual rate of 32.9 percent in the second quarter of 2020 (corresponding to a drop of 9.5 percent from the first quarter). That is, by far, the most severe drop in the postwar period (the next most significant decline came in the first quarter of 1958, on the order of 10 percent on an annual basis).

daily-covid-cases-per-million-three-day-avg

In the meantime, many U.S. states continue to set daily records for new confirmed COVID-19 cases. Today, the three-day rolling average of new cases per million people in the country reached 194 compared to 32 cases for the world as a whole.

We can therefore expect to see new waves of business closures, which in turn will mean more American workers furloughed and laid off, and therefore a steady stream of initial unemployment claims, in the weeks and months ahead.

It is hard to imagine a worse combination to combat the fallout from the novel coronavirus pandemic than Republican governors, the administration of Donald Trump, the GOP-controlled Senate, and the basic institutions of U.S. capitalism.

claims-18

Initial unemployment claims are starting to rise again.

This morning, the U.S. Department of Labor (pdf) reported that, during the week ending last Saturday, another 1.4 million American workers filed initial claims for unemployment compensation. Last week, it was 1.3 million.

Here is a breakdown of each week:

• week ending on 21 March—3.31 million

• week ending on 28 March—6.87 million

• week ending on 4 April—6.62 million

• week ending on 11 April—5.24 million

• week ending on 18 April—4.44 million

• week ending on 25 April—3.87 million

• week ending on 2 May—3.18 million

• week ending on 9 May—2.69 million

• week ending on 16 May—2.45 million

• week ending on 23 May—2.12 million

• week ending on 30 May—1.90 million

• week ending on 6 June—1.57 million

• week ending on 13 June—1.54 million

• week ending on 20 June—1.48 million

• week ending on 27 June—1.41 million

• week ending on 4 July—1.31 million

• week ending on 11 July—1.31 million

• week ending on 18 July—1.42 million

All told, 52.7 million American workers have filed initial unemployment claims during the past eighteen weeks.

To put that into some kind of perspective, I produced the chart above comparing the cumulative totals of the initial unemployment claims for the current pandemic compared to two other relevant periods: the worst point of the Second Great Depression (from early January to early May 2009) and the weeks immediately preceding the current depression (from the end of November 2019 to late March 2020).

As readers can see in the chart above, the differences are stunning: 11.4 million workers during the Second Great Depression, 3.9 million in the period just before the COVID crisis, and more than 52 million in the past eighteen weeks.

daily-covid-cases-per-million-three-day-avg

In the meantime, the United States continues to set daily records for new confirmed COVID-19 cases. Today, the three-day rolling average of new cases per million people in the United States reached 199 compared to 30.79 cases for the world as a whole.

We can therefore expect to see new waves of business closures, which in turn will mean more American workers furloughed and laid off, and therefore a steady stream of initial unemployment claims.

It is hard to imagine a worse combination to combat the fallout from the novel coronavirus pandemic than Republican governors, the administration of Donald Trump, and U.S. capitalism.

initial claims12

Since the first of June,
Lost my job and lost my room.
I pretend to try,
Even though I tried alone.

— Sufian Stevens, “Flint (For the Unemployed and Underpaid)”

Yesterday morning, the U.S. Department of Labor (pdf) reported that, during the week ending last Saturday, another 1.3 million American workers filed initial claims for unemployment compensation. That’s on top of the 48.7 million workers who were laid off during the preceding fifteen weeks.

Here is a breakdown of each week:

• week ending on 21 March—3.31 million

• week ending on 28 March—6.87 million

• week ending on 4 April—6.62 million

• week ending on 11 April—5.24 million

• week ending on 18 April—4.44 million

• week ending on 25 April—3.87 million

• week ending on 2 May—3.18 million

• week ending on 9 May—2.69 million

• week ending on 16 May—2.45 million

• week ending on 23 May—2.12 million

• week ending on 30 May—1.90 million

• week ending on 6 June—1.57 million

• week ending on 13 June—1.54 million

• week ending on 20 June—1.48 million

• week ending on 27 June—1.41 million

• week ending on 4 July—1.31 million

All told, 50 million American workers have filed initial unemployment claims during the past sixteen weeks.

To put that into some kind of perspective, I produced a chart comparing the cumulative totals of the initial unemployment claims for the current pandemic compared to two other relevant periods: the worst point of the Second Great Depression (from the middle of January to early May 2009) and the weeks immediately preceding the current depression (from the end of November 2019 to mid-March 2020).

As readers can see in the chart above, the difference is stunning: 10.2 million workers filed initial claims during the worst 16-week period of 2009, 3.5 million from early December to mid-March of this year, and 50 million in the past sixteen weeks.

According to the most recent report from the Bureau of Labor Statistics, the number of unemployed workers actually fell by 3.2 million to 17.8 million in June, leading to an official unemployment rate of 11.1 percent—although, the surveys on which those data are based only capture those who were unemployed in mid-June, before the new wave of business shutdowns and layoffs.

Moreover, even as the protests ignited a national uprising against racism in the aftermath of the police killing of George Floyd and others, African Americans have experienced the slowest recovery of all racial groups. While the official black unemployment rate in June fell (to 15.4 percent), it is still much higher than the white rate (10.1 percent) and higher even than the Hispanic rate (14.5 percent).

On top of that, we should add in the workers who are involuntarily working part-time jobs—in other words, workers who would like to have full-time jobs but have been forced “for economic reasons” to accept fewer hours—and discouraged workers—Americans who are able to work but have given up looking for a job. The reserve army of unemployed and underemployed workers then rises to something on the order of 30 million Americans.

new-covid-cases-per-million

In the meantime, the United States continues to set daily records for new confirmed COVID-19 cases. Yesterday, there were 178 new cases per million people in the United States compared to 27.6 cases for the world as a whole.

We can therefore expect to see new waves of business closures, which in turn will mean more American workers furloughed and laid off, and therefore a steady stream of initial unemployment claims.

The only possible conclusion to draw is that, unless there’s a radical change in the U.S. response, the existing economic and social disaster in the United States will continue to worsen in the weeks and months ahead.

polyp_cartoon_20_years_of_same

There is a specter haunting capitalist development around the globe.

In fact, the latest Human Development Report begins by naming that menacing apparition:

The wave of demonstrations sweeping across countries is a clear sign that, for all our progress, something in our globalized society is not working.

Different triggers are bringing people onto the streets: the cost of a train ticket, the price of petrol, political demands for independence.

A connecting thread, though, is deep and rising frustration with inequalities.

If anything, that’s an understatement. It’s not just “something” that is wrong; contemporary capitalism as a whole is not working, except for a tiny—but quite powerful—group at the top. The rest of us are being subjected to what can only be called inhuman forms of development.

Let’s remember how the United Nations, following the work of Amartya Sen, defines human development:

people’s capabilities—their freedoms to make life choices—are fundamental. Capabilities are at the heart of human development. . .

Capabilities evolve with circumstances as well as with values and with people’s changing demands and aspirations. Today, having a set of basic capabilities—those associated with the absence of extreme deprivations—is not enough. Enhanced capabilities are becoming crucial for people to own the “narrative of their lives.”

For the past 20 years, capabilities have been defined in terms of what a person can be (“beings”) or do (“doings”). The objective of human development is then to expand the set of capabilities of each individual.

What is new in this report is the recognition that there’s nothing fixed about capabilities; the potential to be or do a variety of things evolves and expands as people imagine and demand new possibilities. And right now, those new capabilities—”enhanced capabilities,” in the language of the report—are being frustrated and denied, to all but a tiny minority, by the obscene and still-growing levels of inequality that characterize capitalism in the world today.

Moreover, it’s not just inequalities between nations (e.g., the fact that the difference in life expectancy at birth between low and very high human development countries is still 19 years) that should concern us. Even as inequalities for some basic capabilities are slowly narrowing across most countries (and a great deal, even on that score, remains to be done), disparities within countries continue to grow. Thus, for example, the poorest 20 percent in many middle-income countries can have the same average mortality rate as children from a typical low-income country. And the grotesque levels of inequality in both basic and expanded capabilities that exist now will, unless fundamental changes are made, create even more inequality in the future.* 

That’s because, first, parents’ incomes and circumstances affect their children’s health, education, and incomes. As the authors of the report explain, the disparities in health and other potential capabilities across socioeconomic groups often start before birth and can accumulate up to and through adulthood. Moreover, social mobility tends to be lower in more unequal societies, thereby cementing the inequalities that currently exist and passing them on to the next generations. Finally, the interplay between inequality and the dynamics of power mean that

Income and wealth inequalities are often translated into political inequality, in part because inequalities depress political participation, giving more space to particular interest groups to shape decisions in their favour. Those privileged can capture the system, moulding it to fit their preferences, potentially leading to even more inequalities. Power asymmetries can even lead to breakdowns in institutional functions, weakening the effectiveness of policies. When institutions are captured by the wealthy, citizens are less willing to be part of social contracts (the sets of rules and expectations of behaviour that people voluntarily conform to that underpin stable societies). When that translates into lower compliance with paying taxes, it diminishes the state’s ability to provide quality public services. That can in turn lead to greater inequalities in health and education. When the overall system is perceived as unfair, possibly due to systematic exclusions or clientelism (the exchange of political support for personal gain), people tend to withdraw from political processes, amplifying the influence of elites.

In other words, existing inequalities are even more consequential than might appear because they not only affect current outcomes, they also set the conditions that shape economic and social outcomes in the future.

The result, as the report makes clear, is that hundreds of millions of people are denied the freedom to exercise their capabilities. They may see them, as practiced by a few at the top. They may imagine and claim still others, as the promise of the realm of freedom expands with new technologies, values, and forms of social interaction.

But the only capabilities they’re allowed to acquire and exercise are those that serve to reproduce the economic system that generates economic and social inequalities in the first place. In recent decades, they’ve been permitted many of the basic capabilities—such as early childhood survival, primary education, and incomes sufficient to purchase some of the commodities they produce. And even then, only unevenly and inconsistently. Severe gaps between those at the top and everyone else remain. But fundamental inequalities exist and continue to grow in terms of enhanced capabilities, including access to decent healthcare at all levels, high-quality advanced education, and access to new technologies.

So, what’s the outlook looking forward? On one hand, the report makes clear, existing inequalities hinder the kinds of redistributions of resources from those at the top that would make the world more equal:

But the richest, though few in number, can be an obstacle to expanding services. And they can frustrate action in multiple ways, through lobbying, donating to political campaigns, influencing the press and using their economic power in other ways in response to decisions they dislike.

And the compound effect of existing and emerging inequalities, technological change, and the climate crisis will certainly make remedial actions down the road even more challenging.

On the other hand, surveys have revealed rising perceptions of inequality, rising preferences for greater equality, and rising global inequality in subjective perceptions of well-being. So, while people often misperceive—by underestimating—actual income and wealth inequality, the proportion of people desiring more equality has risen over the past decade. Across the world: in the United States, Western Europe, Latin America, and elsewhere. And the combination of achieving more widespread basic capabilities and the desire for more equal enhanced capabilities means that people have more freedom to criticize and imagine alternatives to the existing, inhuman forms of global capitalist development. 

The solution, of course, is political. As Ben Phillips explains, in his boxed statement in the report, recognizing the problem of inequality and even a formal commitment to tackle it are not enough.

The one generalizable lesson of social change seems to be that no one saves others; people liberate themselves by standing together. Change can be slow, and it is always complicated and sometimes fails—but it is the only way it works. Change is not given; it is won. By overcoming deference, building collective power and building a new story, inequality can beat inequality.

That possibility of mass movements from below—with workers banding together to exercise and expand their collective capabilities—is, of course, the spectral threat to global capitalism today.


*One of the worst examples of capabilities inequality in the world today is the United States. One study, from the Institute for Child, Youth and Family Policy at Brandeis University [ht: ja], which is too recent to have been included in the Human Development Report, reveals a sharp ethnic and racial divide in access to children’s opportunities in almost every major metropolitan area of the country.

opportunity.jpg

cartoon-growth

Special mention

10-17-2019-mcfadden-915

4801

Special mention

Don't Kill Yourself, Kill a Jerk

Cartoon of the day

Posted: 8 September 2019 in Uncategorized
Tags: , , ,

globecon600px