Archive for October, 2022
The world according to Bloomberg
Posted: 28 October 2022 in UncategorizedTags: 1 percent, capitalism, Democrats, elections, middle-class, poor, Republicans, United States, wealth, workers

The story currently being peddled by the folks at Bloomberg [ht: ja] is that the American middle-class is currently suffering, as the enormous wealth they managed to accumulate during the past few years is now dwindling. And that crisis—the end of their “once-in-a-generation wealth boom”—is what they will take into the midterm elections.
There is a kernel of truth in that story but it is overshadowed by all that it leaves out.
The small sliver of truth?

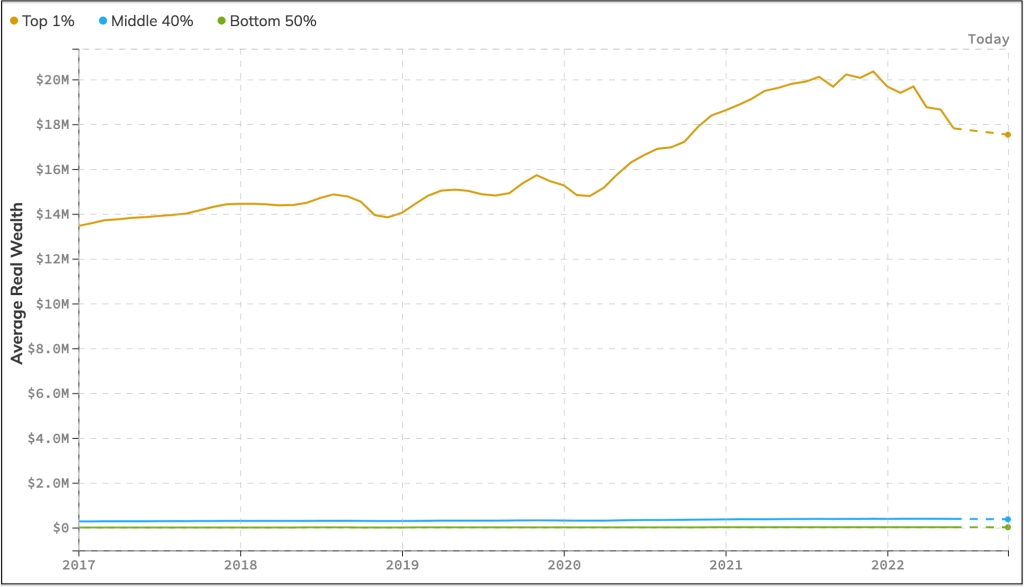
Yes, as we can see in this chart, the average real wealth (in July 2022 dollars) of the middle 40 percent of Americans did in fact increase from January 2017 (when Donald Trump first took office) until March of 2022; now it has begun to fall and is projected to continue declining (according to data provided by Realtime Inequality).*
That should come as no surprise. It is the result of years of cheap money, which has fueled increases in the value of the two major components of middle-class wealth: house prices and the stock market. Now, while the price of real estate continues to rise (as anyone knows who has attempted to purchase a house in recent months), the stock market has taken a tumble (with the Fed policy of increasing interest-rates, on top of disruptions in global supply chains and the war in Ukraine).
So, yes, middle-class wealth is falling. But that’s only part of the what is going on out there, beyond Bloomberg’s narrow lens.
Another important part of the story, which I discussed on Wednesday, is the plight of the bottom 50 percent of American workers. Yes, their average wealth also increased during the same period but not by much more than a rounding error: a total of $13.8 thousand for each person. Their average wealth at the most recent peak reached $12 thousand, and not it too is beginning to fall.
What else is left out of the Bloomberg story? Well, it only refers to the absolute level of middle-class wealth.

As is clear from the chart above, the average wealth of the middle-class (the blue line) is much closer to that of the bottom 50 percent (the green line) than it is to the wealth of the top 1 percent (the brown line): $366.5 thousand compared to $11.9 thousand and $17.5 million, respectively. That doesn’t look like much of a bonanza to me, certainly not in relative terms.
Indeed, the third major part of the missing story has to do with the changes over time in the shares of wealth owned by each of the the classes.

The fact is, the middle-class share of total wealth has been steadily declining since the mid-1980s (falling from 35.7 percent to 28.9 percent), while that of the entire bottom 50 percent has also decreased (from a minuscule 2 percent to a barely perceptible 1.2 percent). Meanwhile, the share of wealth owned by the top 1 percent has soared dramatically (from 21.8 percent to 34.6 percent).
If we add those three elements to Bloomberg’s story, we end up with a very different narrative about the U.S. economy. American workers—both poor and middle-class—have been losing out to those at the top for decades now.
Yes, along the way, there have been minor peaks and troughs in their accumulation of wealth (just as has been the case for those at the top) but the long-term trajectory is clear: a growing gulf between those at the top and everyone else. Under both Democratic and Republican administrations.
It’s a problem that will not be solved in this midterm election, not with the candidates and campaigns we’re seeing from both political parties.
It’s a fundamental problem with American capitalism. But that, alas, does not fit into the Bloomberg story either.
———
*The middle 40 percent is the population whose wealth falls between the 50th and 90th percentiles.
What’s wealth got to do with it?
Posted: 26 October 2022 in UncategorizedTags: 1 percent, corporations, inequality, inflation, mainstream economics, United States, wealth, workers

In a recent article in The Intercept, Jon Schwarz [ht: db] arrives at a perfectly reasonable conclusion—but, unfortunately, he makes a real hash of the data concerning changes in wealth ownership in the United States.
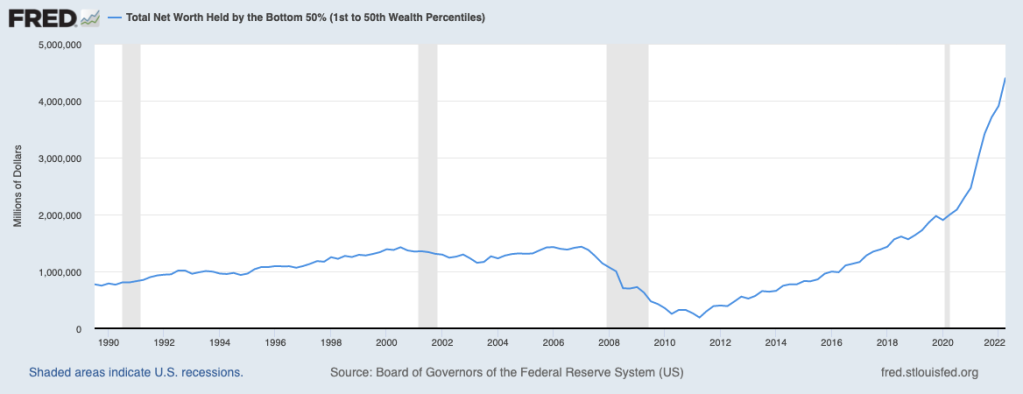
Schwarz starts with the fact that the total amount of wealth owned by the bottom 50 percent of the U.S. population has doubled since the first quarter of 2020 (in other words, during the pandemic). He then takes issue with the idea that economic growth needs to be slowed (for example, by the Fed’s raising of interest-rates) in order to help the poorest who presumably have been most hurt by inflation. And his conclusion?
According to the actual numbers, these are good times for many, many Americans in the poorer 50 percent. That doesn’t mean that millions aren’t struggling, but the financial prospects for most were even worse in the past in a lower-inflation world, a situation that did not excite the warm concern of the corporate media. What we should concentrate on now is keeping the streak going, not bludgeoning the workforce into submission.
I agree, at least in part: what policymakers are attempting to do (in a move supported by mainstream economists, large corporations, and the top 1 percent) is to bludgeon workers into submission. And there’s no reason to do so, especially when other policies—such as regulating prices, raising taxes on the rich, and imposing windfall profits taxes on large corporations—exist.
As for the rest of Schwarz’s argument, there are serious problems.
Let’s start with the idea that, in his view, these are good times for many Americans in the poorest 50 percent. This is based entirely on recent data concerning the net worth of those at the bottom has risen.

As is evident in the chart above, Schwarz’s claim about the rising wealth of the bottom 50 percent (the blue line) is in fact correct. It has been going up in absolute terms for more than a decade (since 2011), and it has gone up particularly quickly in the past two years.
Here’s the problem: the rising net worth of the bottom 50 percent is almost entirely due to the increase in housing prices (which therefore raises the net worth of those who own houses). But that doesn’t say anything about how well-off they are. They don’t get any extra income from those higher-priced homes. They therefore can’t purchase more or better commodities. And they can’t sell their homes to buy other ones because the other ones will also have increased in price.
So, that part of Schwarz’s argument doesn’t hold water. An increase in net worth based on higher housing prices doesn’t improve the well-being of those in the bottom 50 percent.
There’s nothing to rest his case on in terms of the absolute amount of wealth. What about in relative terms?

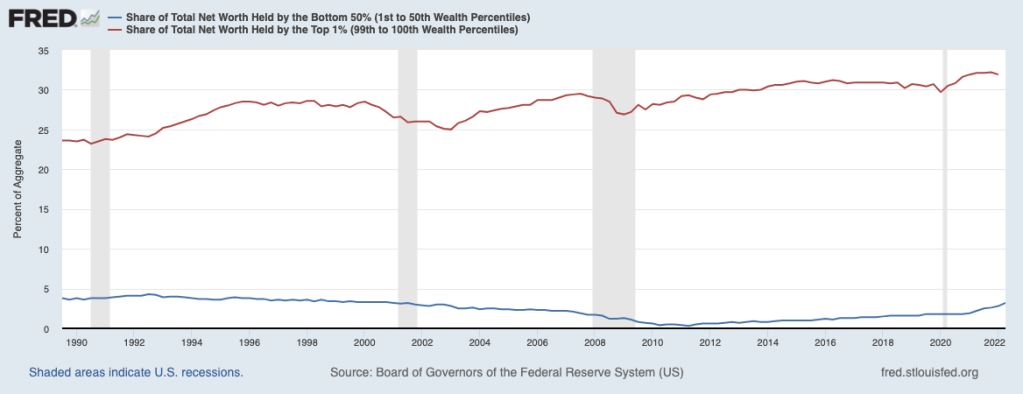
As it turns out, the increase in the net worth of the bottom 50 percent (again, the blue line in the chart immediately above) does lead to an increase in its share of total net worth—but only by 1 percent point, from 1.8 percent to 2.8 percent. It’s still below the share it had two decades ago. It only looks like an improvement because the share had fallen so low (to 0.3 percent, in 2011).
And compared to the top 1 percent (the red line in the chart)? The gulf between their respective shares has actually risen in the past two years. As of the first quarter of 2022, the share of total worth of the top 1 percent was 31.9 percent compared to the tiny (2.8-percent) share of the bottom 50 percent.
So, the bottom 50 percent is no better off in terms of net worth either in absolute or relative terms. In fact, against what Schwarz argues, the last several years have in fact been an economic disaster for the bottom half of U.S. households. Whatever improvement they’ve seen in terms of net worth is a chimeric dream.
I want to make one final point about the issue of net worth, which is often treated synonymously with wealth (including by Schwarz). As I argued above, whatever tiny bit of wealth those at the bottom have is almost entirely in the form of their houses. They don’t own any real wealth—call it financial or business wealth—of the sort that would allow them to have any role in making decisions about their economy.*
The top 1 percent do in fact have such a role, because they are able to convert their share of the surplus into real wealth, which allows them both to get more distributions of the surplus (through, for example, their ownership of equity shares in businesses) and to make the decisions (through their positions within those businesses, the financing of political campaigns, and the like) that do determine the trajectory of the economy and economic policy-making.
I’m entirely on Schwarz’s side in terms of opposing the current bludgeoning of workers on behalf of the 1 percent. But the better argument, it seems to me, is not to say that things should continue as before because the poorest households in the United States were better off, but to show that American workers have increasingly been beaten down, in both absolute and relative terms, precisely because of the pandemic and the profoundly unequal terms of the economic recovery.
Enough is enough. We have to adopt alternative economic policies in the short term, policies that don’t transfer all the costs of inflation-fighting onto the backs of workers. And then imagine and create a radically different form of economic organization moving forward.
———
*As I showed back in 2018, the top 1 percent owned almost two thirds of the financial or business wealth, while the bottom 90 percent (not just the poorest 50 percent) had only six percent.


