Posts Tagged ‘1 percent’

The story currently being peddled by the folks at Bloomberg [ht: ja] is that the American middle-class is currently suffering, as the enormous wealth they managed to accumulate during the past few years is now dwindling. And that crisis—the end of their “once-in-a-generation wealth boom”—is what they will take into the midterm elections.

There is a kernel of truth in that story but it is overshadowed by all that it leaves out.

The small sliver of truth?

Yes, as we can see in this chart, the average real wealth (in July 2022 dollars) of the middle 40 percent of Americans did in fact increase from January 2017 (when Donald Trump first took office) until March of 2022; now it has begun to fall and is projected to continue declining (according to data provided by Realtime Inequality).*

That should come as no surprise. It is the result of years of cheap money, which has fueled increases in the value of the two major components of middle-class wealth: house prices and the stock market. Now, while the price of real estate continues to rise (as anyone knows who has attempted to purchase a house in recent months), the stock market has taken a tumble (with the Fed policy of increasing interest-rates, on top of disruptions in global supply chains and the war in Ukraine).

So, yes, middle-class wealth is falling. But that’s only part of the what is going on out there, beyond Bloomberg’s narrow lens.

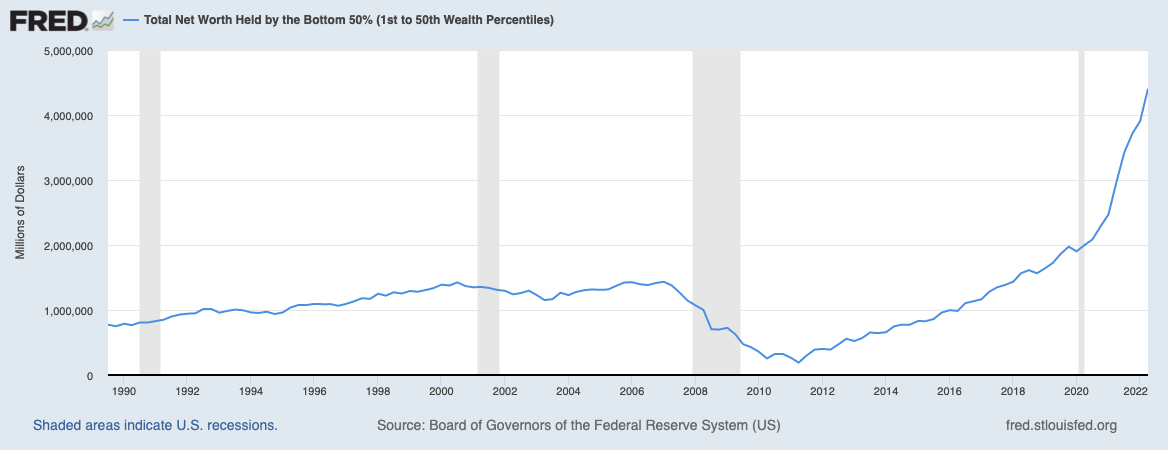
Another important part of the story, which I discussed on Wednesday, is the plight of the bottom 50 percent of American workers. Yes, their average wealth also increased during the same period but not by much more than a rounding error: a total of $13.8 thousand for each person. Their average wealth at the most recent peak reached $12 thousand, and not it too is beginning to fall.

What else is left out of the Bloomberg story? Well, it only refers to the absolute level of middle-class wealth.

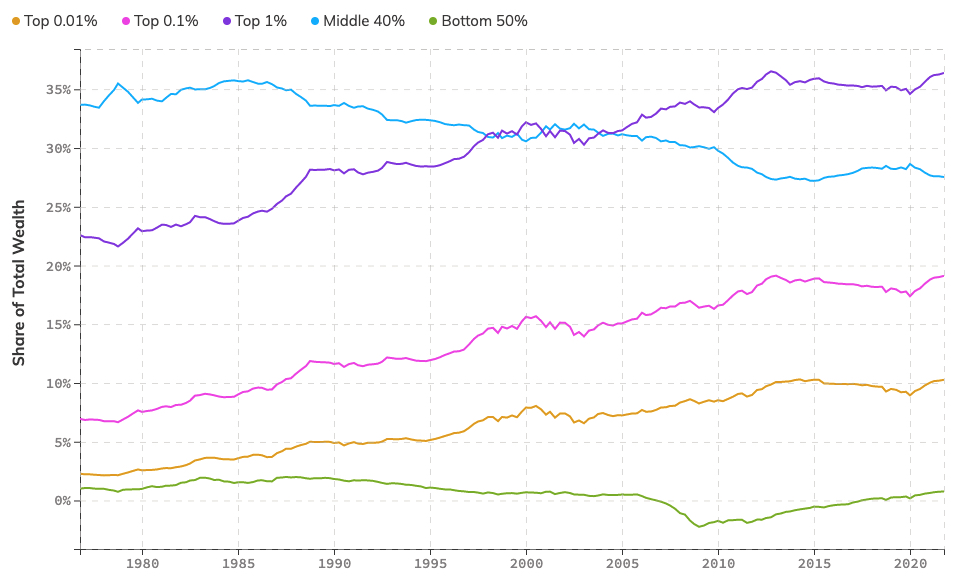
As is clear from the chart above, the average wealth of the middle-class (the blue line) is much closer to that of the bottom 50 percent (the green line) than it is to the wealth of the top 1 percent (the brown line): $366.5 thousand compared to $11.9 thousand and $17.5 million, respectively. That doesn’t look like much of a bonanza to me, certainly not in relative terms.

Indeed, the third major part of the missing story has to do with the changes over time in the shares of wealth owned by each of the the classes.

The fact is, the middle-class share of total wealth has been steadily declining since the mid-1980s (falling from 35.7 percent to 28.9 percent), while that of the entire bottom 50 percent has also decreased (from a minuscule 2 percent to a barely perceptible 1.2 percent). Meanwhile, the share of wealth owned by the top 1 percent has soared dramatically (from 21.8 percent to 34.6 percent).

If we add those three elements to Bloomberg’s story, we end up with a very different narrative about the U.S. economy. American workers—both poor and middle-class—have been losing out to those at the top for decades now.

Yes, along the way, there have been minor peaks and troughs in their accumulation of wealth (just as has been the case for those at the top) but the long-term trajectory is clear: a growing gulf between those at the top and everyone else. Under both Democratic and Republican administrations.

It’s a problem that will not be solved in this midterm election, not with the candidates and campaigns we’re seeing from both political parties.

It’s a fundamental problem with American capitalism. But that, alas, does not fit into the Bloomberg story either.

———

*The middle 40 percent is the population whose wealth falls between the 50th and 90th percentiles.

In a recent article in The Intercept, Jon Schwarz [ht: db] arrives at a perfectly reasonable conclusion—but, unfortunately, he makes a real hash of the data concerning changes in wealth ownership in the United States.

Schwarz starts with the fact that the total amount of wealth owned by the bottom 50 percent of the U.S. population has doubled since the first quarter of 2020 (in other words, during the pandemic). He then takes issue with the idea that economic growth needs to be slowed (for example, by the Fed’s raising of interest-rates) in order to help the poorest who presumably have been most hurt by inflation. And his conclusion?

According to the actual numbers, these are good times for many, many Americans in the poorer 50 percent. That doesn’t mean that millions aren’t struggling, but the financial prospects for most were even worse in the past in a lower-inflation world, a situation that did not excite the warm concern of the corporate media. What we should concentrate on now is keeping the streak going, not bludgeoning the workforce into submission.

I agree, at least in part: what policymakers are attempting to do (in a move supported by mainstream economists, large corporations, and the top 1 percent) is to bludgeon workers into submission. And there’s no reason to do so, especially when other policies—such as regulating prices, raising taxes on the rich, and imposing windfall profits taxes on large corporations—exist.

As for the rest of Schwarz’s argument, there are serious problems.

Let’s start with the idea that, in his view, these are good times for many Americans in the poorest 50 percent. This is based entirely on recent data concerning the net worth of those at the bottom has risen.

As is evident in the chart above, Schwarz’s claim about the rising wealth of the bottom 50 percent (the blue line) is in fact correct. It has been going up in absolute terms for more than a decade (since 2011), and it has gone up particularly quickly in the past two years.

Here’s the problem: the rising net worth of the bottom 50 percent is almost entirely due to the increase in housing prices (which therefore raises the net worth of those who own houses). But that doesn’t say anything about how well-off they are. They don’t get any extra income from those higher-priced homes. They therefore can’t purchase more or better commodities. And they can’t sell their homes to buy other ones because the other ones will also have increased in price.

So, that part of Schwarz’s argument doesn’t hold water. An increase in net worth based on higher housing prices doesn’t improve the well-being of those in the bottom 50 percent.

There’s nothing to rest his case on in terms of the absolute amount of wealth. What about in relative terms?

As it turns out, the increase in the net worth of the bottom 50 percent (again, the blue line in the chart immediately above) does lead to an increase in its share of total net worth—but only by 1 percent point, from 1.8 percent to 2.8 percent. It’s still below the share it had two decades ago. It only looks like an improvement because the share had fallen so low (to 0.3 percent, in 2011).

And compared to the top 1 percent (the red line in the chart)? The gulf between their respective shares has actually risen in the past two years. As of the first quarter of 2022, the share of total worth of the top 1 percent was 31.9 percent compared to the tiny (2.8-percent) share of the bottom 50 percent.

So, the bottom 50 percent is no better off in terms of net worth either in absolute or relative terms. In fact, against what Schwarz argues, the last several years have in fact been an economic disaster for the bottom half of U.S. households. Whatever improvement they’ve seen in terms of net worth is a chimeric dream.

I want to make one final point about the issue of net worth, which is often treated synonymously with wealth (including by Schwarz). As I argued above, whatever tiny bit of wealth those at the bottom have is almost entirely in the form of their houses. They don’t own any real wealth—call it financial or business wealth—of the sort that would allow them to have any role in making decisions about their economy.*

The top 1 percent do in fact have such a role, because they are able to convert their share of the surplus into real wealth, which allows them both to get more distributions of the surplus (through, for example, their ownership of equity shares in businesses) and to make the decisions (through their positions within those businesses, the financing of political campaigns, and the like) that do determine the trajectory of the economy and economic policy-making.

I’m entirely on Schwarz’s side in terms of opposing the current bludgeoning of workers on behalf of the 1 percent. But the better argument, it seems to me, is not to say that things should continue as before because the poorest households in the United States were better off, but to show that American workers have increasingly been beaten down, in both absolute and relative terms, precisely because of the pandemic and the profoundly unequal terms of the economic recovery.

Enough is enough. We have to adopt alternative economic policies in the short term, policies that don’t transfer all the costs of inflation-fighting onto the backs of workers. And then imagine and create a radically different form of economic organization moving forward.

———

*As I showed back in 2018, the top 1 percent owned almost two thirds of the financial or business wealth, while the bottom 90 percent (not just the poorest 50 percent) had only six percent.

In the world according to Paul Krugman, “most Americans” have gotten considerably richer over the past two years (even if “the gains have been especially big at the top”), “lower-income Americans [have] seen relatively large income gains,” and “the simple story that the pandemic has been great for the wealthy and bad for the working class doesn’t hold up.”

Really?

To support his argument, Krugman trots out a series of charts from Realtime Inequality, which is in fact an eye-opening set of statistics on wealth and income inequality in the United States. But not in the way Krugman uses them. The two biggest problems in Krugman’s treatment are (a) he excludes the bottom 50 percent (so that “most Americans” refers only to the middle 40 percent) and (b) he focuses on growth rates and not levels or shares of income and wealth (so that, once again, we have that pesky problem of large percentage increases on a low base yields small increases).

That’s how you lie with inequality statistics.

What happens if you look at other statistics? Let’s start with wealth.

Here, I’ve depicted the shares of wealth for various deciles of the U.S. population: top 0.01 percent, top 0.1 percent, top 1 percent, middle 40 percent, and bottom 50 percent. Lo and behold, we can see that, starting in 1979, the shares of wealth held by those at the very top have soared, the share of the middle 40 percent has fallen, and the share of the bottom 50 percent hasn’t budged.

What about for the most recent period (which is what Krugman focuses on), from the end of 2019 to the end of 2021. Same thing: the shares of wealth of the top 1 percent (and subsets of that group) have continued to rise, the share of the middle 40 percent has fallen, and the share of the bottom 50 percent has actually risen.

Wow! The share of wealth owned by the bottom 50 percent (which consists mostly of housing they may own) has gone up. By how much? From a minuscule amount to another minuscule amount—from 0.3 percent to 0.8 percent. Or, in absolute terms, from an average wealth of $2.9 thousand to $7.9 thousand—a difference of $5 thousand. You might even say such an increase means a lot to the 125 million people in the bottom 50 percent of the U.S. population but it’s certainly no more than a drop in the bucket in terms of closing the gap with the wealth of those at the top (for example, the $19 million of wealth owned by those in the top 1 percent).

What about income? Same problem.

The growth rate of post-tax income for those in the bottom 50 percent was, in fact, much higher than for those in the middle 40 percent and top 1 percent—8.5 percent compared to 3.8 percent and 4.1 percent, respectively.

And that proves what? Not much. Those in the bottom 50 percent gained $2.8 thousand (mostly from transfer payments), which is similar to the gain for those in the middle 40 percent ($3.2 thousand). And those in the top 1 percent? Well, they managed to capture an extra $48 thousand during the period from late 2019 to late 2021.

So, sure, wages for those at the bottom are growing at a faster rate than those at the top. But they’re still barely staying ahead of inflation. And they’re not such as to even put a dent in the gap that separates them from the incomes captured by those at the top. The share of post-tax income taken home by all those workers in the bottom 50 percent only increased from 20.1 percent to 20.9 percent, while the share of income captured by the 2.5 million people in the top 1 percent is still 14.4 percent.

All of which means what? That the gap between workers at the bottom (including those in the middle) and the small group at the top continues to be enormous—in terms of both wealth and income. And no policy of keeping existing interest-rates or increasing them will help close that obscene gap.

It’s time we stop lying with inequality statistics and focus on the real culprit: all the ways contemporary capitalism, both before and during the pandemic, has managed to funnel most of the surplus to those at the top of the economic pyramid, leaving barely enough wealth and income to get by for everyone else.

It’s a “simple story,” with clear political implications. Maybe that’s the reason the Krugmans of the world don’t want to tell it. . .

Year 3 of the Trump presidency was absolutely terrific—indeed, record-breaking—for Americans.

At least that’s how things look in terms of the headline numbers from the Census Bureau: median household income was up (by 6.8 percent, a record) over 2018 and the official poverty rate decreased (by 1.3 percentage points, to 10.5 percent, the lowest rate observed since estimates were initially published for 1959).*

And then there’s Kevin Hassett, former chair of Trump’s White House Council of Economic Advisers (who returned to the White House to lead its pandemic-response team, downplaying the danger of coronavirus and pushing the administration to re-open the economy amid lockdowns and social distancing) who seized on the report to make another of his wild claims:

If you’re a social justice warrior and you’re looking at the data, you would have to say that the Trump years, through the beginning of the pandemic, were the sort-of best years for advances in social justice since World War II.

The problem is that other data in the same report show nothing of the sort.

The distribution of income in the United States was just as grotesquely unequal in 2019 as it was in 2018 (and in every year both before and now during the Trump presidency). The highest quintile of American households captured 51.9 percent of income in the United States (it was 52 percent in 2018), the fourth quintile 22.7 percent (compared to 22.6 percent the previous year), and so on down the line. The lowest quintile got 3.1 percent, exactly the same as in 2018.

So no, no “social justice warrior” would be able to say the Trump years were the “best years for advances in social justice since World War II.”

In fact, quite the opposite. The economic policies of the Trump administration are both the product of and serving to reinforce the fundamental inequalities that have characterized the United States for decades now.

They’re also the reason why the novel coronavirus pandemic has hit the United States so savagely and unevenly. As I argued back in May, and Nick Hanauer and David M. Rolf recently concurred in Time,

Like many of the virus’s hardest hit victims, the United States went into the COVID-19 pandemic wracked by preexisting conditions. A fraying public health infrastructure, inadequate medical supplies, an employer-based health insurance system perversely unsuited to the moment—these and other afflictions are surely contributing to the death toll. But in addressing the causes and consequences of this pandemic—and its cruelly uneven impact—the elephant in the room is extreme income inequality.

The basis of their claim about inequality in the United States is a new working paper by Carter C. Price and Kathryn Edwards [ht: mfa] of the RAND Corporation, “Trends in Income From 1975 to 2018.”

While their general claim is pretty familiar (the pattern of capitalist growth in the United States during the two or three decades after World War II lowered the degree of inequality but, beginning in the mid-1970s, the trend was reversed and inequality rose during every decade), their analysis of the new pattern of capitalist growth reveals just how obscene it has been.

Consider the following conclusions from their study:

  • On average, extreme inequality is costing the median income full-time worker about $42,000 a year. Half of all full-time workers now earn less than half what they would have had incomes across the distribution continued to keep pace with economic growth.
  • The median male worker needed 30 weeks of income in 1985 to pay for housing, healthcare, transportation, and education for his family. By 2018, that “Cost of Thriving Index” had increased to 53 weeks (more weeks than in an actual year).
  • Two-income families are now working twice the hours to maintain a shrinking share of the pie, while struggling to pay housing, healthcare, education, childcare, and transportation costs that have grown at two to three times the rate of inflation.

Basically, according to Price and Edwards’s calculations, the income growth for most groups of Americans—thus, the bottom 25 percent, the median, the bottom 90 percent, and so on—was less than the rate of growth of real per capita Gross Domestic Product. Only the incomes of those in the top 5 percent grew at a faster rate. Thus, for example, the aggregate income for the population below the 90th percentile after 1975 would have been 67 percent higher in 2018 had income growth followed the pattern of the first two post-War decades.

The cumulative result over the past 45 years is that the members of the bottom 90 percent lost almost $50 trillion ($47 trillion or $48.6, depending on the price deflator used), which was seized by those at the top, especially the richest 1 percent of Americans.**

That pattern of unequal growth, which was inherited by the Trump administration, has simply not changed in the last three and a half years, no matter what Trump, Haslett, or the other “hacks and grifters” in the White House say.

Moreover, the monstrous inequalities that existed at the end of 2019 have shaped in profound ways both the effects of the spread of the coronavirus across the country and the early stages of the recovery from the Pandemic Depression. American economic economic and political elites have demanded and been able to implement policies that have only served to reinforce the unequalizing pattern of economic growth, which left most Americans vulnerable to the pandemic and to the resulting economic downturn.

The unequal pattern of capitalist growth in the United States documented in the new RAND report is exactly the opposite of what social justice warriors have been fighting for. Everyone, except the tiny group at the top, have been the ultimate losers.

———

*But there is a caveat on the median household income figures: the bureau’s main household survey for the report on Income and Poverty in the United States: 2019 was conducted in March and April of this year, as the pandemic was surging. That lowered the response rate, especially among low-income Americans. Still, the bureau estimates that median income in 2019 was about 4.1 percent higher than in 2018.

**The missing piece in the story told by Price and Edwards has to do with the mechanism of the massive transfer from the bottom 90 percent to those at the top. I have tried to fill in that missing piece, most recently in 2019 (e.g., here and here).

The phrase, which was used in the early nineteenth century to describe the the spoils system of appointing government workers, accurately describes the American economy today.* And it’s pretty clear who the victor is, and it’s not the working-class.

Instead, a small group at the top have come out as the victor—and that’s been true for decades now.

How do we know?

Well, all we have to do is look at the growing gap between the amount produced by American workers and what they received in their wages. Gross Domestic Product (the green line in the chart above) grew by a factor of almost 16 from 1973 onward while workers’ wages increased by a bit more than 5 before the COVID Depression.

So, American workers only received back in the form of wages a small percentage of the increased amount they produced. The rest went to their employers.

The result has been an enormous rise in U.S. corporate profits (before tax, without inventory valuation and capital consumption adjustments)—particularly evident in the trendline fitted to the data in the chart above.

The employers, in turn, transferred a portion of those profits to the Chief Executive Officers of their corporations.

According to the latest report from the Economic Policy Institute, in 2019, a CEO at one of the top 350 firms in the United States was paid $21.3 million on average (using a “realized” measure of CEO pay that counts stock awards when vested and stock options when cashed in rather than when granted). The ratio of CEO-to-typical-worker compensation was therefore 320-to-1 (222.8-to-1 using a different, “granted” measure of CEO pay). That is up from 293-to-1 in 2018 and a gigantic increase from 61.4-to-1 in 1989 and, even more, 21.1-to-1 in 1965.

Exorbitant CEO pay is a major contributor to rising inequality that we could safely do away with. CEOs are getting more because of their power to set pay—and because so much of their pay (about three-fourths) is stock-related, not because they are increasing productivity or possess specific, high-demand skills. This escalation of CEO compensation, and of executive compensation more generally, has fueled the growth of top 1.0% and top 0.1% incomes, leaving less of the fruits of economic growth for ordinary workers and widening the gap between very high earners and the bottom 90%. The economy would suffer no harm if CEOs were paid less (or were taxed more).

An even large—and growing—distribution of the surplus that is the basis of corporate profits has taken the form of dividends, paid to owners of corporate equities. In 1965, dividends were about 26 (25.8) percent of corporate profits; by the beginning of this year they were almost 70 (69.2) percent.

And according to my calculations, the top 1 percent in the United States owns (as of 2014, the last year for which data are available) 62 percent of corporate equities, which has been climbing since the late 1970s. Meanwhile, the share of the entire bottom 90 percent has been falling, and is now only 11 percent.

So, it’s really only the small group at the top that is in a position to “share in the booty” by receiving a cut of corporate profits in the form of CEO pay and stock dividends. They’ve occupied the position of victor for decades now, and to them belong the economic spoils.**

Everyone else is forced to have the freedom to try to get by on their slowly rising wages—and to watch with both fascination and horror the ongoing spectacles in corporate boardrooms and the stock market.

——————

*”To the victor belong the spoils” is attributed to Senator William Learned Marcy of New York who, in 1832, defended Andrew Jackson, whose campaign against President John Quincy Adams was seen partly as a vendetta against Adams, and whose conduct and remarks when taking office seemed to justify the association of Jackson with the spoils system.

**Just yesterday, in the midst of the pandemic and the worst economic downturn since the Great Depression of the 1930s, the U.S. stock market reached a new high (according to the Standard & Poor’s 500 index).

Voter-Burnout

Special mention

trump-hijacks-usps  BACK-TO-SCHOOL-COVIDweb

mw31cg5f286746734a2

Special mention

941

unions

It’s clear, at least to many of us, that if the United States had a larger, stronger union movement things would be much better right now. There would be fewer cases and deaths from the novel coronavirus pandemic, since workers would be better paid and have more workplace protections. There would be fewer layoffs, since workers would have been able to bargain for a different way of handling the commercial shutdown. And there would be more equality between black and white workers, especially at the lower end of the wage scale.

But, in fact, the American union movement has been declining for decades now, especially in the private sector. Just since 1983, the overall unionization rate has fallen by almost half, from 20.1 percent to 10.3 percent. That’s mostly because the percentage of private-sector workers in unions has decreased dramatically, from 16.8 percent to 6.2 percent. And even public-sector unions have been weakened, declining from a high of 38.7 percent in 1994 to 33.6 percent last year.

The situation is so dire that even Harvard economist Larry Summers (along with his coauthor Anna Stansbury) has had to recognize that the “broad-based decline in worker power” is primarily responsible for “inequality, low pay and poor work conditions” in the United States.*

Summers is, of course, the extreme mainstream economist who has ignited controversy on many occasions over the years. The latest is when he was identified as one as one of Joe Biden’s economic advisers back in April. Is this an example, then, of a shift in the economic common sense I suggested might be occurring in the midst of the pandemic? Or is it just a case of belatedly identifying the positive role played by labor unions now that they’re weak and ineffective and it’s safe for to do so?

I’m not in a position to answer those questions. What I do know is that the theoretical framework that informs Summers’s work has mostly prevented him and the vast majority of other mainstream economists from seeing and analyzing issues of power, struggle, and class exploitation that haunt like dangerous specters this particular piece of research.

Let’s start with the story told by Summers and Stansbury. Their basic argument is that a “broad-based decline in worker power”—and not globalization, technological change, or rising monopoly power—is the best explanation for the increase in corporate profitability and the decline in the labor share of national income over the past forty years.

Worker power—arising from unionization or the threat of union organizing, firms being run partly in the interests of workers as stakeholders, and/or from efficiency wage effects—enables workers to increase their pay above the level that would prevail in the absence of such bargaining power.

So far, so good. American workers and labor unions have been under assault for decades now, and their ability to bargain over wages and working conditions has in fact been eroded. The result has been a dramatic redistribution of income from labor to capital.

labor share

Clearly, as readers can see in the chart above, using official statistics, the labor share of national income fell precipitously, by almost 10 percent, from 1983 to 2020.**

profit rate

Not surprisingly, again using official statistics, the profit rate has risen over time. The trendline (the black line in the chart above), across the ups and downs of business cycles, has a clear upward trajectory.***

Over the course of the last four decades is that, as workers and labor unions have been decimated, corporations have been able to pump out more surplus from their workers, thereby lowering the wage share and increasing the profit rate.

But that’s not how things look in the Summers-Stansbury world. In their view, worker power only gives workers an ability to receive a share of the rents generated by companies operating in imperfectly competitive product markets. So, theirs is still a story that relies on exceptions to perfect competition, the baseline model in the world of mainstream economic theory.

And that’s why, while their analysis seems at first glance to be pro-worker and pro-union, and therefore amenable to the concerns of dogmatic centrists, Summers and Stansbury hedge their bets by references to “countervailing power,” the risk of increasing unemployment, and “interferences with pure markets” that “may not enhance efficiency” if measures are taken to enhance worker power.

Still, within the severe constraints imposed by mainstream economic theory, moments of insight do in fact emerge. Summers and Stansbury do admit that the wage-profit conflict that is at the center of their story does explain the grotesque levels of inequality that have come to characterize U.S. capitalism in recent decades—since “some of the lost labor rents for the majority of workers may have been redistributed to high-earning executives (as well as capital owners).” Therefore, in their view, “the decline in labor rents could account for a large fraction of the increase in the income share of the top 1% over recent decades.”

The real test of their approach would be what happens to workers’ wages and capitalists’ profits in the absence of imperfect competition. According to Summers and Stansbury, workers would receive the full value of their marginal productivity, and there would be no need for labor unions. In other words, no power, no struggle, and no class exploitation.

That’s certainly not what the world of capitalism looks like outside the confines of mainstream economic extremism. It’s always been an economic and social landscape of unequal power, intense struggle, and ongoing class exploitation.

The only difference in recent decades is that capital has become much stronger and labor weaker, at least in part because of the theories and policies produced and disseminated by mainstream economists like Summers and Stansbury. Now, as they stand at the gates of hell, it may just be too late for their extreme views and the economic and social system they have so long celebrated.

*The link in the text is to the column by Summers and Stansbury published in the Washington Post. That essay is based on their research paper, published in May by the National Bureau of Economic Research.

**We need to remember that the labor share as calculated by the Bureau of Labor Statistics includes incomes (such as the salaries of corporate executives) that should be excluded, since they represent distributions of corporate profits.

***I’ve calculated the profit as the sum of the net operating surpluses of the nonfinancial and domestic financial sectors divided by the net value added of the nonfinancial sector. The idea is that the profits of both sectors originate in the nonfinancial sector, a portion of which is distributed to and realized by financial enterprises. The trendline is a second-degree polynomial.

mini_magick20200223-1-b917oz

Special mention

richdemcolorLARGE

pett-moron

Special mention

01-30-2020-mcfadden-915px