Posts Tagged ‘statistics’

In the world according to Paul Krugman, “most Americans” have gotten considerably richer over the past two years (even if “the gains have been especially big at the top”), “lower-income Americans [have] seen relatively large income gains,” and “the simple story that the pandemic has been great for the wealthy and bad for the working class doesn’t hold up.”

Really?

To support his argument, Krugman trots out a series of charts from Realtime Inequality, which is in fact an eye-opening set of statistics on wealth and income inequality in the United States. But not in the way Krugman uses them. The two biggest problems in Krugman’s treatment are (a) he excludes the bottom 50 percent (so that “most Americans” refers only to the middle 40 percent) and (b) he focuses on growth rates and not levels or shares of income and wealth (so that, once again, we have that pesky problem of large percentage increases on a low base yields small increases).

That’s how you lie with inequality statistics.

What happens if you look at other statistics? Let’s start with wealth.

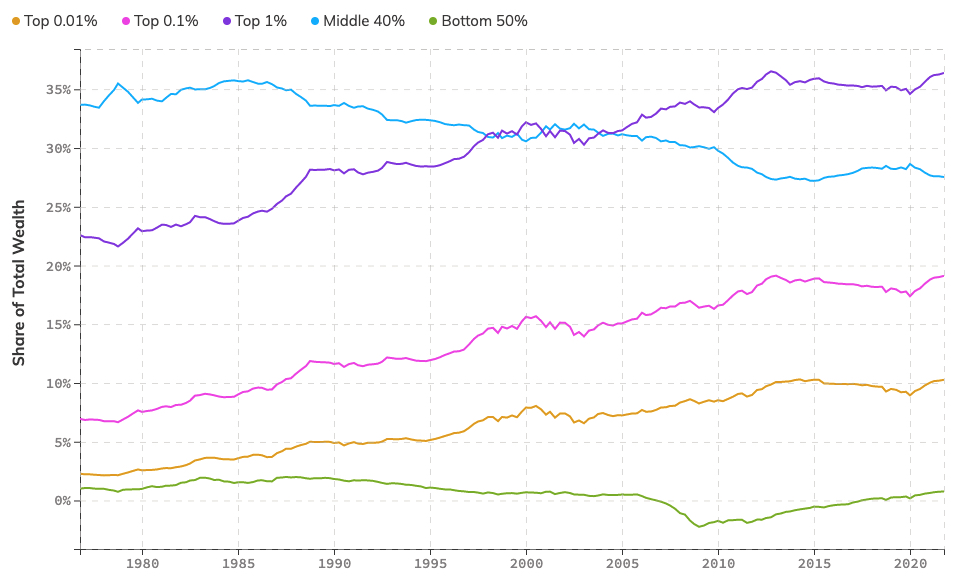
Here, I’ve depicted the shares of wealth for various deciles of the U.S. population: top 0.01 percent, top 0.1 percent, top 1 percent, middle 40 percent, and bottom 50 percent. Lo and behold, we can see that, starting in 1979, the shares of wealth held by those at the very top have soared, the share of the middle 40 percent has fallen, and the share of the bottom 50 percent hasn’t budged.

What about for the most recent period (which is what Krugman focuses on), from the end of 2019 to the end of 2021. Same thing: the shares of wealth of the top 1 percent (and subsets of that group) have continued to rise, the share of the middle 40 percent has fallen, and the share of the bottom 50 percent has actually risen.

Wow! The share of wealth owned by the bottom 50 percent (which consists mostly of housing they may own) has gone up. By how much? From a minuscule amount to another minuscule amount—from 0.3 percent to 0.8 percent. Or, in absolute terms, from an average wealth of $2.9 thousand to $7.9 thousand—a difference of $5 thousand. You might even say such an increase means a lot to the 125 million people in the bottom 50 percent of the U.S. population but it’s certainly no more than a drop in the bucket in terms of closing the gap with the wealth of those at the top (for example, the $19 million of wealth owned by those in the top 1 percent).

What about income? Same problem.

The growth rate of post-tax income for those in the bottom 50 percent was, in fact, much higher than for those in the middle 40 percent and top 1 percent—8.5 percent compared to 3.8 percent and 4.1 percent, respectively.

And that proves what? Not much. Those in the bottom 50 percent gained $2.8 thousand (mostly from transfer payments), which is similar to the gain for those in the middle 40 percent ($3.2 thousand). And those in the top 1 percent? Well, they managed to capture an extra $48 thousand during the period from late 2019 to late 2021.

So, sure, wages for those at the bottom are growing at a faster rate than those at the top. But they’re still barely staying ahead of inflation. And they’re not such as to even put a dent in the gap that separates them from the incomes captured by those at the top. The share of post-tax income taken home by all those workers in the bottom 50 percent only increased from 20.1 percent to 20.9 percent, while the share of income captured by the 2.5 million people in the top 1 percent is still 14.4 percent.

All of which means what? That the gap between workers at the bottom (including those in the middle) and the small group at the top continues to be enormous—in terms of both wealth and income. And no policy of keeping existing interest-rates or increasing them will help close that obscene gap.

It’s time we stop lying with inequality statistics and focus on the real culprit: all the ways contemporary capitalism, both before and during the pandemic, has managed to funnel most of the surplus to those at the top of the economic pyramid, leaving barely enough wealth and income to get by for everyone else.

It’s a “simple story,” with clear political implications. Maybe that’s the reason the Krugmans of the world don’t want to tell it. . .

BureauofLaborStatistics-0a868acbc1dd4b67a4f0dcfcb2bf040b

There are lies, there are outrageous lies, and there are statistics.

— Robert Giffen, Economic Journal (1892)

Are U.S. unemployment numbers rigged? Sure, they are!

They’re not rigged in the way Paul Krugman implied last Friday (“This being the Trump era, you can’t completely discount the possibility that they’ve gotten to the BLS”). Or in the way former General Electric CEO Jack Welch suggested back in 2012 (when he asserted that the Obama White House had manipulated the job figures for political gains). Or in the way Donald Trump used to say the unemployment rate was “phony” (“The number is probably 28, 29, as high as 35 [percent]. In fact, I even heard recently 42 percent.”) until, of course, he became president and declared the rising jobs numbers a “blowout” (even though he and his economic advisers used some questionable math) and, most recently, the falling unemployment rate a “great day” (for George Floyd, whom Trump said was “looking down right now and saying this is a great thing that’s happening for our country,” and “for everybody”).

No, the jobs numbers are not manipulated in those ways. They’re rigged—in my view, much more seriously—in terms of the ways the various categories are defined and measured and the manner in which the data are collected. And, of course, the ways values are imputed to the rising and falling numbers.

Let’s start with the last point: why should we believe, as most news outlets and Trump himself proclaimed (including FiveThirtyEight, which declared it “shockingly good”), that the much-publicized recent fall in the official unemployment rate (from 14.7 percent in April to 13.3 percent in May) is a good thing? We’re still in the midst of the COVID-19 pandemic, when workers should be paid to stay home. Instead, they’re being forced to have the freedom to return to selling their ability to work—because their employers want to make profits by hiring them and workers themselves are finding it difficult to get by on unemployment benefits (when, that is, they’ve been able to obtain them). Why is that something we should applaud?

Moreover, even according to the unadjusted numbers, there were still 21 million unemployed American workers in May. Let’s remember that, at the worst point of the Second Great Depression (in October 2009), the highest unemployment rate was 10 percent and the largest number of unemployed workers was 15.4 million.

As for the rest, the first sign there may be a problem with the unemployment numbers is the admission, in the text of the official report from the Bureau of Labor Statistics, that many workers may have been misclassified. Workers who were “employed but absent from work” were supposed to be counted as “unemployed on temporary layoff” but many, it seems, were not.

If the workers who were recorded as employed but absent from work due to “other reasons” (over and above the number absent for other reasons in a typical May) had been classified as unemployed on temporary layoff, the overall unemployment rate would have been about 3 percentage points higher than reported (on a not seasonally adjusted basis).

Fixing that error would raise the official unemployment rate in May to 16.3 percent.

Now, let’s consider what the official statistics mean and don’t mean. This is an exercise I used to do with all of my students, most of whom had no idea how the unemployment numbers were defined and calculated, even after taking many mainstream economics courses.

The official or headline unemployment rate is actually one of 6 rates reported by the Bureau of Labor Statistics, referred to as U-3. To be counted as unemployed according to the U-3 rate, a worker has to (a) have had a job, (b) been laid off from a job, and (c) be actively looking for a new job. (In addition, they’re not counted if they’re in the armed forces, in prison, or undocumented.)

The rates and total numbers of officially unemployed workers, from January 2007 to May 2020, are illustrated in the two charts below.

LNS14000000_390681_1591454536897 LNS13000000_390681_1591454536844

So, who is not included in these numbers? The headline unemployment rate doesn’t include workers (such as high school and college graduates) who are looking for their first jobs. It doesn’t include workers who are involuntarily working at part-time jobs (working any number of hours, including 1 hour a week, counts as “employed”). And it doesn’t include workers who want a job but are “discouraged” and therefore have given up actively looking for a job.

The so-called U-6 rate includes two of those groups, in addition to the unemployed workers that form the U-3 rate: workers who are employed part-time for “economic reasons” and workers who are considered “marginally attached” to the labor force.

rates

As readers can see, the U-6 rate (the green line in the chart above) is always much higher than the U-3 rate (the blue line). In May, it was 21.2 percent, compared to the rate of 13.3 percent that was widely reported in news outlets.

And then there’s the group of 4.8 million workers who were considered misclassified in the most report. Add them all together and the United States actually had a total of 45.4 million workers who were either unemployed or underemployed in May. That’s exactly one-third the size of the entire employed population in the United States.

But that U-6 plus misclassified total still doesn’t adequately capture the dire straits of American workers. In addition to first-time job-seekers who have unable to find a job (some unknown portion of an estimated 3.8 million high-school graduates, 1 million who graduated with associate’s degrees, and 2 million with bachelor’s degrees), it doesn’t include any of the estimated 8 million undocumented workers who have lost their jobs.

The only conclusion is that the official unemployment figures are in fact rigged—not by any particular malfeasance or corrupt intervention into the Bureau of Labor Statistics, but by the way the unemployed are defined, measured, and counted. The reserve army of unemployed and underemployed workers is actually much larger than the figures cited by the White House and widely reported in news outlets.

In the end, what matters for American workers is less that the statistics are biased. It’s more that the prevailing economic institutions in the United States—which use and abuse them as wage-slaves, no more so than during the current pandemic—are rigged against them.

Ctd0Y0FWgAAJZjT.jpg

The idea that GDP numbers don’t tell us a great deal about what is really going on in the world is becoming increasingly widespread.

GDP-DL

David Leonhardt, in reflecting the emerging view, has argued that GDP doesn’t “track the well-being of most Americans.”

Now, we’d expect that someone like socialist Democratic candidate Bernie Sanders would question the extent to which the low unemployment numbers, associated with economic growth, hardly tells the whole story about the condition of the American working-class.

Unemployment is low but wages are terribly low in this country. And many people are struggling to get the health care they need to take care of their basic needs.

But even centrist candidates Joe Biden and Pete Buttigieg are making the case that the headline numbers, such as Gross Domestic Product and stock indices, hide the fact “that a very different reality exists for many Americans who have not seen much improvement in their own bottom lines.”

And one of the last people you’d expect to question the shared gains from economic growth, Robert Samuelson, thinks that “something momentous is clearly occurring.”

economic inequality continues to rise at a steady pace; the further you go up the income scale, the larger the income gains, both relatively and absolutely. . .

The great danger here is social and political. It is the creation, or the expansion, of a multi-tiered society where the largest income gains are enjoyed by relatively small groups of people near the top of the economic distribution.

So, let’s step back a bit and see what these numbers reveal—and what they mostly hide.

GDP-S&P

First, as is clear from the chart immediately above, the growth in the value of U.S. stock markets (as measured by the S&P 500 Index, the red line) doesn’t tell us much about actual economic growth (as indicated by the value of Gross Domestic Product, the blue line). For example, between 2010 and 2019, the stock market increased by 163 percent, while GDP grew by only 46 percent.

Second, neither number alone indicates what is happening to the vast majority of Americans. For example, as I argued back in 2017, ownership of stocks in the United States is grotesquely unequal: while about half of U.S. households hold stocks in publicly traded companies (directly or indirectly), the bottom 90 percent of U.S. households own only 18.6 percent of all corporate stock. The rest (81.4 percent) is in the hands of the top 10 percent.

Well, then, what about GDP?

fredgraph (1)

It’s obvious from this chart that the increases in all the indicators of average income in the United States—real median personal income (the red line), real mean personal income (green), and real median household income (purple)—are much lower than the increase in real (inflation-adjusted) GDP. Those discrepancies reveal the fact that the average person or household is benefiting much less than they otherwise would from economic growth. And, of course, the gap increases over time, as in every year people fall further and further behind.

So, all that the GDP numbers indicate is that the monetary value of final goods and services produced and sold in the United States—the “immense accumulation of commodities” that represents the wealth of a capitalist society—is growing. But it doesn’t tell us anything about who gets what, that is, how the incomes generated during the course of producing those commodities are distributed. In other words, GDP numbers are a poor indicator of people’s well-being.

So, what would tell us something about how Americans are faring in the midst of the so-called recovery from the Second Great Depression?

Leonhardt’s view is that “distributional accounts”—that is, estimates of income shares for every decile of the income distribution, as well as for the top 1 percent—will change the national discussion whenever GDP numbers are released.

I don’t know if they’ll change the terms of debate but they will certainly challenge the presumption that GDP (and other headline numbers, such as stock market indices) accurately the economic and social health of the nation.

saez

Thus, for example, as Emmanuel Saez (pdf) has shown, by 2017, real incomes of the bottom 99 percent had still not recovered from the losses experienced during the initial years of the Second Great Depression (from 2007 to 2009), while families in the top 1 percent families captured almost half (49 percent) of total real income growth per family from 2009 to 2017. And, as a result of growing inequality, the 50.6 percent top 10 percent income share in 2017 (with capital gains) is virtually as high as the absolute peak of 50.6 percent reached in 2012.

CBO

Moreover, according to the Congressional Budget Office (pdf), income before transfers and taxes is projected to be more unequally distributed in 2021 than it was in 2016. And while means-tested transfers and federal taxes serve to reduce income inequality, the reduction in inequality stemming from transfers and taxes is actually projected to be smaller in 2021 than it was in 2016.

All of these distributional effects of the current mode of production in the United States are hidden from view by the usual headline economic numbers.

But there’s one more step that can and should be taken. The distributional accounts that have been used to change the discussion focus on the size distribution of income, that is, the distribution of income to groups of individuals (and individual households) that make up the population. What is missing, then, is the factor or class distribution of income.

profits-wages

In the chart above, I have illustrated the changing ratio of corporate profits to workers’ wages in the United States from 1968 to 2018.* Two things are remarkable about the trajectory of this ratio. First, beginning in 2001, the ratio more than doubled, from a low of 0.31 to a high of 0.70 (in 2006). And, second, even though the ratio has fallen in recent years, it still remains as of 2018 much higher (at 0.52) than during the pre-2001 period.**

However inequality is measured—in terms of the size or class distribution of income—it is obvious that most Americans are not sharing in the growth of national income (or, for that matter, the stock-market gains) in recent years.

The focus on GDP (and stock indices, unemployment rates, and the like) serves merely to hide from view what the American workers clearly understand: they’re being left behind.


*This is the ratio of, in the numerator, corporate profits before tax (without IVA and CCAdj) and, in the denominator, the total wages paid to production and nonsupervisory workers (assuming a work year of 50 weeks). It is clearly similar to but different from the Marxian rate of exploitation, surplus-value divided by the value of labor power—since, among things, it does not include distributions of the surplus to members of the top 10 percent in the numerator.

**A third observation is also relevant: the ratio of profits to wages has fallen prior to every recession since 1968. The recent decline in the ratio (since 2013) therefore portends another recession in the near future. However, I’m no more keen on making predictions than on coming up with New Year’s resolutions. It was John Kenneth Galbraith who wisely wrote, “There are two kinds of forecasters: those who don’t know, and those who don’t know they don’t know.”

WP

Everyone’s seen the screaming headlines: the middle-class is back!

The statistic backing up those headlines is median household income (as reported by the Census Bureau), which in 2016 was $59,039.

median

After years of decline, following the crash of 2000-01 and then again in 2007-08, real median household income (in 2016 dollars) has finally surpassed its previous high—of $58,665 in 1999.

But that’s not the whole story.

First, consider the fact that it took real incomes more than a decade and a half to recover from the collapse. The “good news” is not much consolation for people who endured almost two decades of zero growth in what they took home: their incomes, pensions, and wealth are permanently damaged and likely won’t be repaired within their lifetimes.

Second, the Census Bureau data show that the bulk of the gains in real income in 2016 was explained by one factor: higher employment. In other words, hours worked rose but wages did not. The members of American median households are working harder at more jobs to finally get an increase in incomes.

mean-median

Finally, consider what is measured in those headline numbers. The median, as folks might remember from a statistics course (or just a teacher’s explanation of how they grade), is the “middle” value: half above, and half below. But we can also calculate the mean (or “average” value) and compare the two. As is clear from the chart, while both the median and mean values (the green and red lines in the chart, measured on the left, respectively) have reached all-time highs, the gap between them—the “skew” in the distribution—has also grown over time. In fact, the ratio of the mean and median incomes (the blue line, measured on the right) has increased—from 1.23 in 1980 to 1.41 in 2016.

This is a clear indication that, while median household incomes in the United States have finally recovered from the crises of recent years, the middle-class itself is falling further and further behind those at the top.

Wouldn’t it be useful if those income statistics were reported in the headlines!

story-2

Regular readers know I take statistics quite seriously. So, as it turns out, did Stephen Jay Gould who, in the most poignant story about statistics of which I am aware, explained how important it is to go beyond the abstractions of central tendencies and understand the distribution of variation within the numbers.

And right now, when the numbers are under attack—when, for example, the new Trump administration is threatening to purge the inconvenient numbers about climate change—it is even more important to understand the role statistics play in economic and social life.*

William Davies [ht: ja] offers one story about statistics, starting with the recent populist attacks on public statistics and the questioning of the experts that produce and interpret them. His view is that, for all their faults, the numbers collected and disseminated by technical experts within national statistical offices need to be defended—as the representation of “common ideas of society and collective progress”—against the rise of private “data.”

A post-statistical society is a potentially frightening proposition, not because it would lack any forms of truth or expertise altogether, but because it would drastically privatise them. Statistics are one of many pillars of liberalism, indeed of Enlightenment. The experts who produce and use them have become painted as arrogant and oblivious to the emotional and local dimensions of politics. No doubt there are ways in which data collection could be adapted to reflect lived experiences better. But the battle that will need to be waged in the long term is not between an elite-led politics of facts versus a populist politics of feeling. It is between those still committed to public knowledge and public argument and those who profit from the ongoing disintegration of those things.

I understand the threat posed by big, private data—all those numbers that are collected “behind our backs and beyond our knowledge” when we travel, make purchases, and participate in social media, and in turn are utilized to sell us even more commodities (including, of course, political candidates).

But I also think Davies, in his rush to condemn private control over big data, presents too uncritical of a defense of “the kinds of unambiguous, objective, potentially consensus-forming claims about society that statisticians and economists are paid for.”

Consider, for example, one of the “unambiguous, objective, potentially consensus-forming claims about society” Davies himself cites: GDP. Just last Friday, the headlines reported that the U.S. economy grew “only” 1.6 percent during the last quarter of 2016, “the lowest level in five years.”

The presumption was that the decline in the number (with respect to both previous quarters and economists’ forecasts) represented a fundamental problem. But why should it—why should a decline in the growth rate of GDP be taken as a sign of something that needs to be fixed?

Davies does mention that GDP “only captures the value of paid work, thereby excluding the work traditionally done by women in the domestic sphere, has made it a target of feminist critique since the 1960s.” But the controversies surrounding that particular statistic are much more widespread than Davies would have us believe. As a number of recent books (including Ehsan Masood’s The Great Invention: The Story of GDP and the Making and Unmaking of the Modern World) have clearly explained, the initial formulation of that particular measure of national income as well as subsequent revisions have involved theoretical and political choices about what should and should not be included—government expenditures but not labor within households, the production of fossil fuels but not the destruction of the natural environment, sales of private security but not the growing inequality it is designed to protect against.**

Even more fundamentally, GDP is a measure of market transactions, of goods and services produced—and thus the contemporary counting of the elements celebrated by Adam Smith’s notion of the “wealth of nations.” But what it doesn’t measure are the conditions under which those commodities are produced.

Me, I’d be much more willing to join forces with Davies and defend the claims about society that statisticians and economists are paid for if they were also paid to calculate and publicly report one other number, S/V, the rate of exploitation.


**We should remember that perhaps the real hero of volume 1 of Capital was Leonard Horner, who as a factory inspector “carried on a life-long contest, not only with the embittered manufacturers, but also with the Cabinet, to whom the number of votes given by the masters in the Lower House, was a matter of far greater importance than the number of hours worked by the ‘hands’ in the mills.”

**Other useful books on GDP include the following: Philipp Lepenies’s The Power of a Single Number: A Political History of GDP (Columbia University Press, 2016), Lorenzo Fioramonti’s Gross Domestic Problem: The Politics Behind the World’s Most Powerful Number (Zed Books, 2013), and Thomas A. Stapleford’s The Cost of Living in America: A Political History of Economic Statistics, 1880-2000 (Cambridge University Press, 2009).

10

Mark Tansey, “Coastline Measure” (1987)

The pollsters got it wrong again, just as they did with the Brexit vote and the Colombia peace vote. In each case, they incorrectly predicted one side would win—Hillary Clinton, Remain, and yes—and many of us were taken in by the apparent certainty of the results.

I certainly was. In each case, I told family members, friends, and acquaintances it was quite possible the polls were wrong. But still, as the day approached, I found myself believing the “experts.”

It still seems, when it comes to polling, we have a great deal of difficulty with uncertainty:

Berwood Yost of Franklin & Marshall College said he wants to see polling get more comfortable with uncertainty. “The incentives now favor offering a single number that looks similar to other polls instead of really trying to report on the many possible campaign elements that could affect the outcome,” Yost said. “Certainty is rewarded, it seems.”

But election results are not the only area where uncertainty remains a problematic issue. Dani Rodrik thinks mainstream economists would do a better job defending the status quo if they acknowledged their uncertainty about the effects of globalization.

This reluctance to be honest about trade has cost economists their credibility with the public. Worse still, it has fed their opponents’ narrative. Economists’ failure to provide the full picture on trade, with all of the necessary distinctions and caveats, has made it easier to tar trade, often wrongly, with all sorts of ill effects. . .

In short, had economists gone public with the caveats, uncertainties, and skepticism of the seminar room, they might have become better defenders of the world economy.

To be fair, both groups—pollsters and mainstream economists—acknowledge the existence of uncertainty. Pollsters (and especially poll-based modelers, like one of the best, Nate Silver, as I’ve discussed here and here) always say they’re recognizing and capturing uncertainty, for example, in the “error term.”

silver

Even Silver, whose model included a much higher probability of a Donald Trump victory than most others, expressed both defensiveness about and confidence in his forecast:

Despite what you might think, we haven’t been trying to scare anyone with these updates. The goal of a probabilistic model is not to provide deterministic predictions (“Clinton will win Wisconsin”) but instead to provide an assessment of probabilities and risks. In 2012, the risks to to Obama were lower than was commonly acknowledged, because of the low number of undecided voters and his unusually robust polling in swing states. In 2016, just the opposite is true: There are lots of undecideds, and Clinton’s polling leads are somewhat thin in swing states. Nonetheless, Clinton is probably going to win, and she could win by a big margin.

slide_24

As for the mainstream economists, while they may acknowledge exceptions to the rule that “everyone benefits” from free markets and international trade in some of their models and seminar discussions, they acknowledge no uncertainty whatsoever when it comes to celebrating the current economic system in their textbooks and public pronouncements.

So, what’s the alternative? They (and we) need to find better ways of discussing and possibly “modeling” uncertainty. Since the margins of error, different probabilities, and exceptions to the rule are ways of hedging their bets anyway, why not just discuss the range of possible outcomes and all of what is included and excluded, said and unsaid, measurable and unmeasurable, and so forth?

The election pollsters and statisticians may claim the public demands a single projection, prediction, or forecast. By the same token, the mainstream economists are no doubt afraid of letting the barbarian critics through the gates. In both cases, the effect is to narrow the range of relevant factors and the likelihood of outcomes.

One alternative is to open up the models and develop a more robust language to talk about fundamental uncertainty. “We simply don’t know what’s going to happen.” In both cases, that would mean presenting the full range of possible outcomes (including the possibility that there can be still other possibilities, which haven’t been considered) and discussing the biases built into the models themselves (based on the assumptions that have been used to construct them). Instead of the pseudo-rigor associated with deterministic predictions, we’d have a real rigor predicated on uncertainty, including the uncertainty of the modelers themselves.

Admitting that they (and therefore we) simply don’t know would be a start.

there_is_no_escape_1821975

Special mention

download 181704_600

CBO-SS1

The Social Security system, now in its 81st year, is (according to the Congressional Budget Office [pdf]) solvent until 2029. In that year, the trust fund will be exhausted—but, still, even without any changes, the program will be able to pay out at least 71 percent of mandated benefits. And all it would take is eliminating the earnings cap (currently $118,500) to make the program fully financed for the foreseeable future.

But you wouldn’t know that from Wharton economist Olivia S. Mitchell, who like many others who have attempted to propose “reforms” to the system attempts to gin up the numbers. Her particular version is to get people to delay taking their monthly payments by promising them a lump-sum payout at the later date.

The problem, of course, is we should be doing exactly the opposite—lowering the retirement age and expanding benefits (which we could do by eliminating the earnings cap).

Even more, as Michael Hiltzik explains, Mitchell cites a particular statistic in order to create the specter of a system facing imminent crisis, to which she can then offer a “painless solution.”

The questionable part of her article appears near the bottom, where she writes:

“The Social Security shortfall is enormous. Actuaries have estimated that it’s on the order of $28 trillion in present value. That’s twice the size of the gross domestic product of the U.S. So a small delay in claiming won’t solve the problem. We’re also going to have to change the benefit formula. We’re going to have to make changes in the retirement age.” (Emphasis added.)

Most Social Security experts view that $28-trillion figure as a red flag. That’s because many people who cite it are ideologues aiming to scare the public into thinking the program’s finances are far worse than they really are. Let’s see what makes the statistic, and Mitchell’s use of it, so misleading.

The figure is an estimate of the present value of Social Security’s unfunded obligation not as it exists today, but as if it were calculated out to infinity. Economists find the so-called infinite horizon model useful in some contexts. But as it’s typically applied to Social Security it’s beloved by ideologues because it produces a really big, and really scary, estimate of the accumulated deficit.

The infinite projection appears in the annual Social Security Trustees Report, but its placement there is controversial. The Social Security Advisory Board’s 2015 technical panel of economists, actuaries and demographers recommended dropping the infinite projection from the trustees reports altogether, for two reasons. One is that it incorporates enormous uncertainties. Estimating costs, revenues and policy changes for Social Security’s conventional 75-year forecasts is hard enough; the influences playing on the program hundreds or thousands of years into the future are literally unimaginable. That makes the infinite projection “unhelpful as a guide to policy-making,” the panel reported.

The second reason is that it’s so vulnerable to misinterpretation. As an earlier technical panel observed, the projection is sometimes “quoted in policy discussions without including its relation to corresponding GDP, which is both misleading and shifts the focus from more useful metrics.”

Interestingly, that’s exactly what Mitchell does. (We should mention in passing that Mitchell actually gets her numbers wrong. The infinite projection deficit, as published by the trustees in their most recent report, was $25.8 trillion as of Jan. 1, not $28 trillion; U.S. GDP, according to the Bureau of Economic Analysis, was $18.2 trillion as of the end of 2015, not $14 trillion as Mitchell implies.)

In her MarketWatch article, Mitchell doesn’t disclose that the figure she’s citing is the infinite projection, which could lead some readers to think she’s talking about Social Security’s current deficit. (In current terms, Social Security actually runs an annual surplus and is expected to do so until 2020.) Even worse, she juxtaposes it with current gross domestic product by stating that it’s “twice the size” of GDP today. The unwary reader might be led to think that a Social Security “crisis” is on the verge of bankrupting the U.S. in the here and now. . .

Mitchell’s lump-sum plan might be a useful element in a Social Security fix if it were entirely clear that a fix was necessary. But the fact that she relied on an exaggerated statistic to make her case suggests that there may not be such a strong case, after all.

The CBO’s projection of the 75-year actuarial deficit of the Social Security program as a share of GDP is only 1.45 percent—not nearly as dramatic as Mitchell’s statistic. It’s a number that doesn’t conjure up crisis or induce panic. All it suggests is that “tweaking” the system (by, as I suggested, raising the earnings cap) will make the program solvent and create the space for what we should really be doing, lowering the retirement age and expanding benefits for American workers.

Lies, damned lies, and Mitchell’s statistic serve a very different purpose.

incarceration_rates_in_oecd_countries_1080_737_80

As everyone knows (or should know), the United States is an international outlier when it comes to incarceration rates.

According to the Hamilton Project,

The U.S. incarceration rate—defined as the number of inmates in local jails, state prisons, federal prisons, and privately operated facilities per every 100,000 U.S. residents—is more than six times that of the typical Organisation for Economic Co-Operation and Development (OECD) country. A variety of factors can explain the discrepancy in incarceration rates. One important factor is higher crime rates, especially rates of violent crimes: the homicide rate in the United States is approximately four times the typical rate among the nations shown in this chart. Additionally, drug control policies in the United States—which have largely not been replicated in other Western countries—have prominently contributed to the rising incarcerated population over the past several decades. Another important factor is sentencing policy; in particular, the United States imposes much longer prison sentences for drug-related offenses than do many economically similar nations.

What that means if there are more than 2 million Americans in prison or jail.

Here’s how the incarceration rate has changed over the past 100-plus years of U.S. history:

Screen-Shot-2015-02-12-at-3.05.01-PM

A baseball player made entirely out of their statistics

Special mention

Stantis-Cant-get-our-goat-1011