Posts Tagged ‘underemployed’

covid-unemployment

To read the mainstream press, you’d think that the U.S. economy—especially the economy from the standpoint of workers—is on the mend.

The New York Times is a good example:

The American economy gained 1.8 million jobs last month, even as the coronavirus surged in many parts of the country and newly reintroduced restrictions caused some businesses to close for a second time.

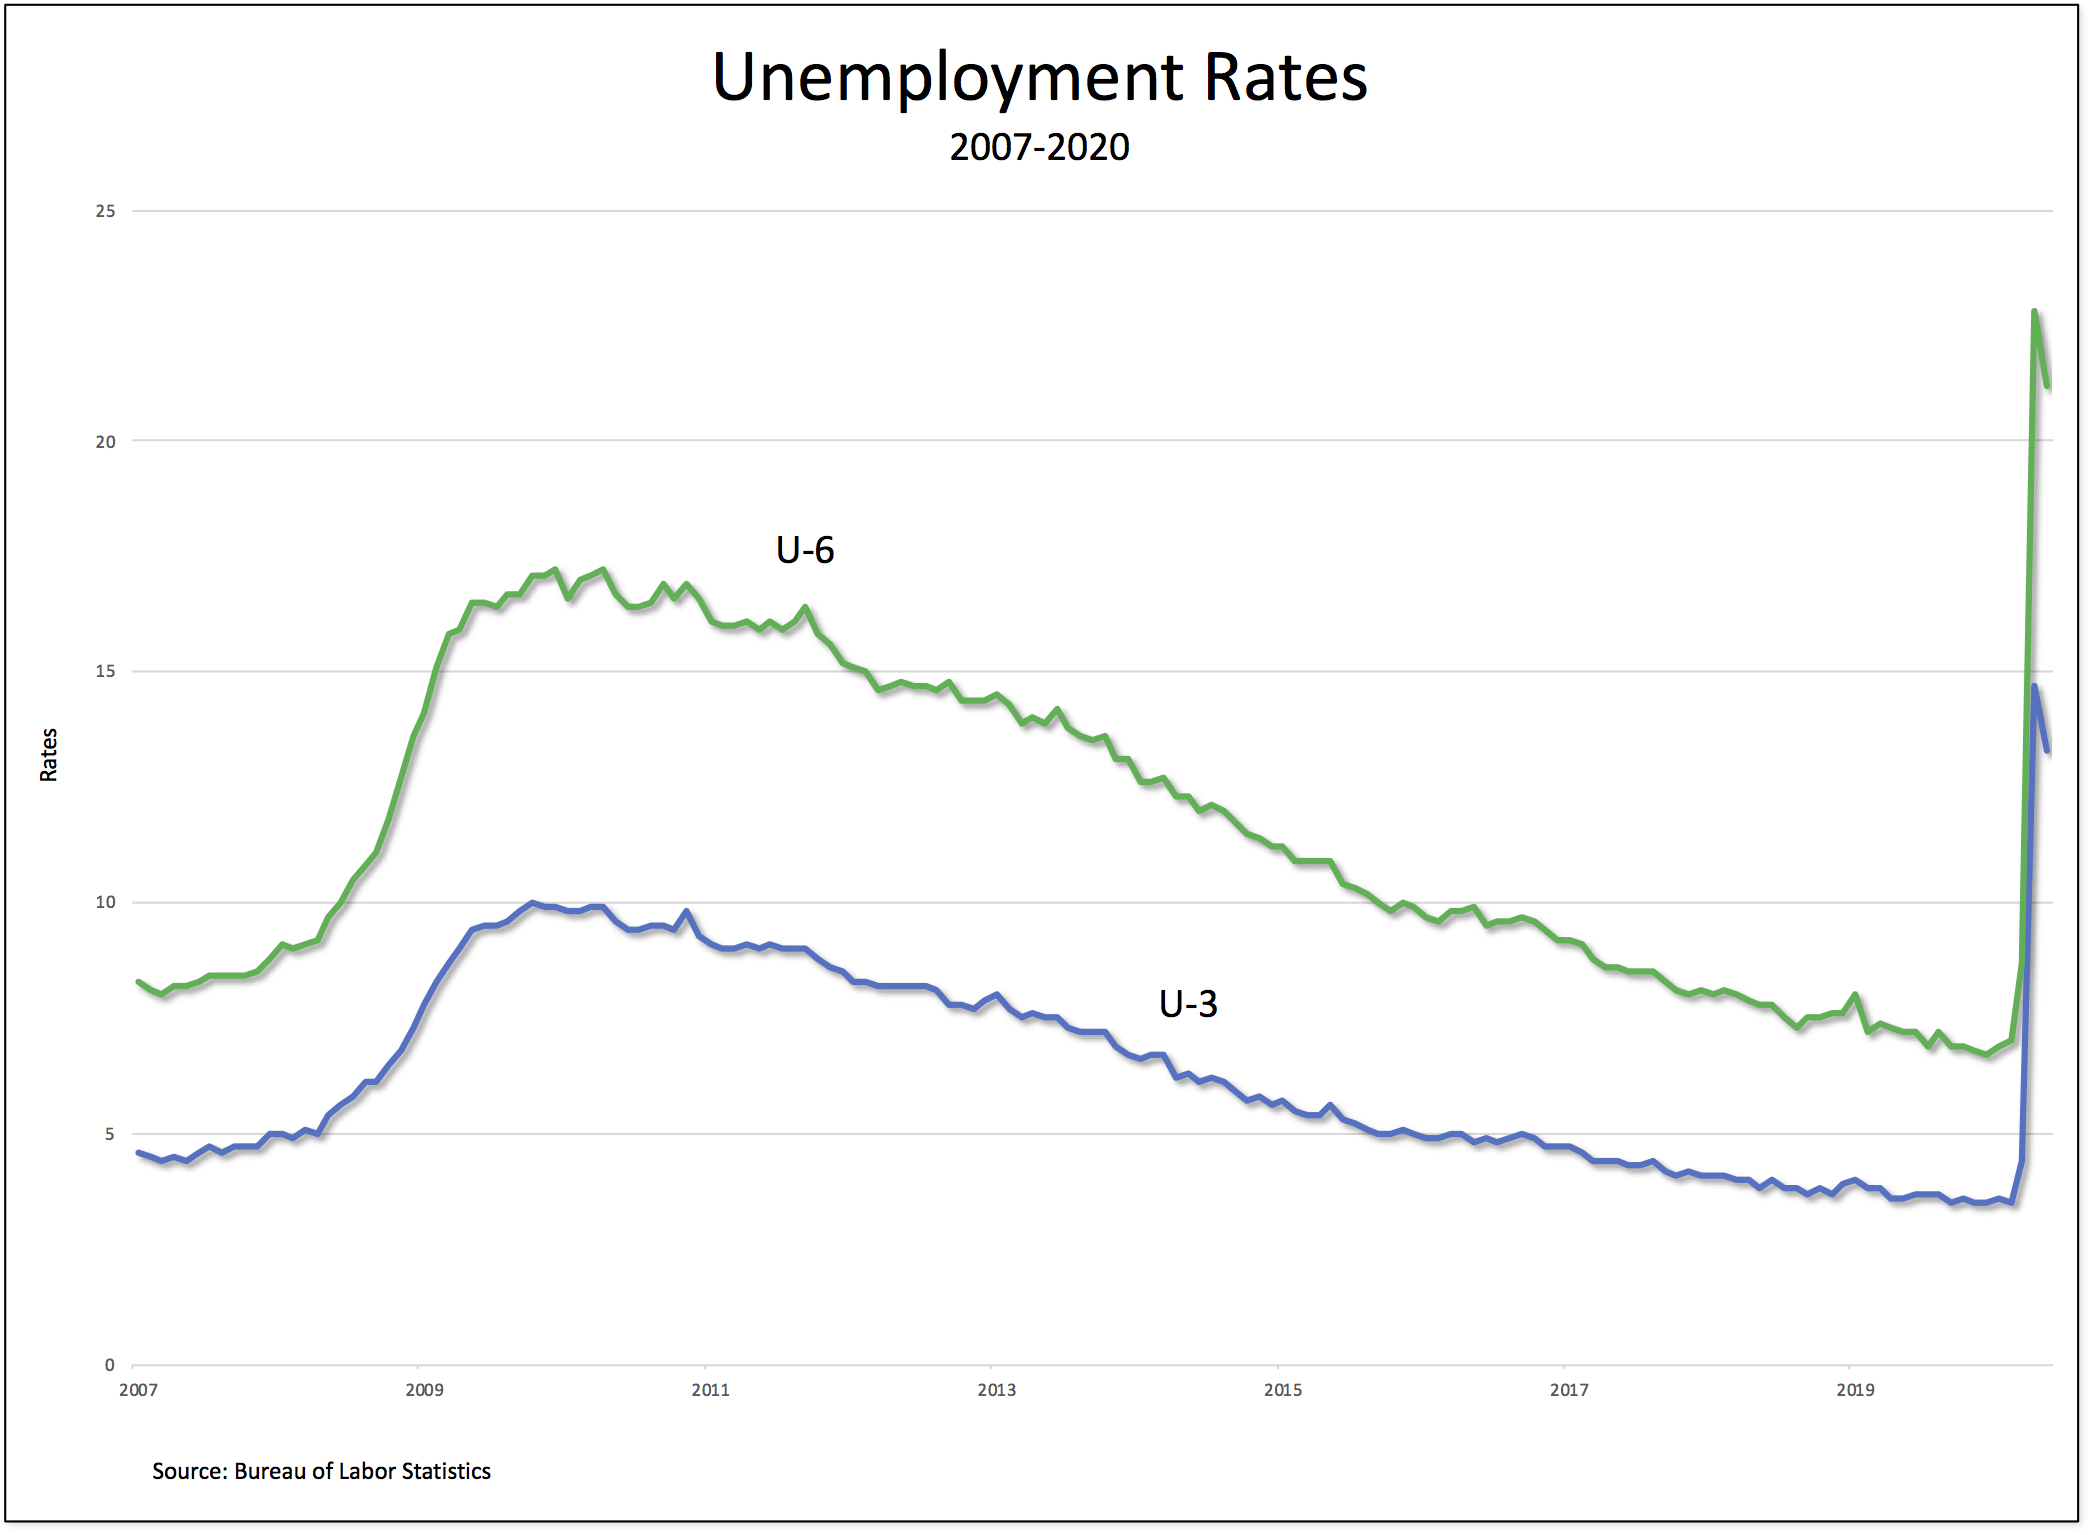
And, it’s true, both the official (U-3) unemployment rate (the orange line in the chart) and the more inclusive (U-6) rate (the green line) have fallen since April. But, at 10.2 and 16.5 percent, respectively, they’re still at or just below what they were during the worst period of the Second Great Depression.

Moreover the percentage of American workers who have been unemployed for 15 weeks or more is on the rise—and can be expected to continue to grow in the months ahead.

The massive Reserve Army of unemployed, long-term unemployed, discouraged, and underemployed workers is serving to discipline and punish workers, both those who have managed to keep their jobs and those who have lost them.

We know this because workers’ pay is going down. At the same time, workers are forced to have the freedom to commute to and labor at their jobs under perilous pandemic conditions, they’re being paid less. According to the Bureau of Labor Statistics, both the average hourly and weekly earnings for production and nonsupervisory workers fell between June and July of this year.*

Meanwhile, now that emergency federal benefits have expired, the unemployed—both continuing cases and newly laid-off workers—will not be receiving the $600-a-week supplement that helped them pay their bills through the spring and early summer.

Instead of raising workers’ wages, to mitigate the effects of the pandemic and to attract them back to work, employers and their political representatives prefer to slash unemployment benefits in order to compel workers to compete for the few jobs that are currently available.

Whichever way you look at it, American workers are the ones who are being forced to shoulder the lion’s share of the costs created by the COVID economic crisis.

*These numbers relate to production employees in mining and logging and manufacturing, construction employees, and nonsupervisory employees in the service-providing industries. These groups account for approximately four-fifths of the total employment on private nonfarm payrolls.

initial claims8

Bullets flyin’, helicopters, police sirens, preachers lying
Genocism, criticism, unemployment, racism. . .
That’s exactly what Hell look like

— Kendrick Lamar, “Heaven & Hell”

This morning, the U.S. Department of Labor (pdf) reported that, during the week ending last Saturday, another 1.5 million American workers filed initial claims for unemployment compensation. That’s on top of the 42.7 million workers who were laid off during the preceding eleven weeks.

Here is a breakdown of each week:

• week ending on 21 March—3.31 million

• week ending on 28 March—6.87 million

• week ending on 4 April—6.62 million

• week ending on 11 April—5.24 million

• week ending on 18 April—4.44 million

• week ending on 25 April—3.87 million

• week ending on 2 May—3.18 million

• week ending on 9 May—2.69 million

• week ending on 16 May—2.45 million

• week ending on 23 May—2.13 million

• week ending on 30 May—1.88 million

• weeks ending on 6 June—1.54 million

All told, 44.21 million American workers have filed initial unemployment claims during the past three months.

To put that into some kind of perspective, I calculated the initial claims totals for two other relevant 12-week periods: the worst point of the Second Great Depression (encompassing the weeks ending on 17, 24, and 31 January, 7, 14, 21, 28 February, 7, 14, 21, and 28 March, and 4 April 2009) and the weeks immediately preceding the current depression (so, 28 December, 4, 11, 18, and 25 January, 1, 8, 15, 22, and 29 February and 7 and 14 March 2020).

As readers can see in the chart above, the difference is stunning: 7.7 million workers filed initial claims during the worst 12-week period of 2009, 2.6 million from late December to mid-March of this year, and 44.2 million in the past twelve weeks.

Once again, keep in mind, the most recent numbers still don’t include perhaps millions of other American workers, since many states are still addressing backlogs of claims. Masses of workers have been unsuccessful in applying for unemployment insurance because state websites and phone lines are inundated and still, even now, not working correctly.

Moreover, because they’re only initial claims, the numbers also don’t include the 7.1 million American workers who were deemed officially unemployed in early March, before most of the shutdowns started.

According to the most recent report from the Bureau of Labor Statistics, the number of unemployed workers fell by 2.1 million to 21.0 million in May, leading to an official unemployment rate of 13.3 percent—although, by correcting the misclassification of a large number of workers (who were classified as employed but absent from work), the official rate would have been about 3 percentage points higher. Moreover, the surveys on which those data are based only capture those who were unemployed in mid-May.

If we allow for the fact that at least some workers have been forced to have the freedom to return to work in recent months, then the total number of fully unemployed workers is something on the order of 38.9 million.* That would mean an unemployment rate of more than 24.6 percent, which is just below the rate last seen in the first Great Depression (25 percent) and almost two and a half times the highest rate (10 percent) suffered during the Second Great Depression.**

On top of that, we should add in the workers who are involuntarily working part-time jobs—in other words, workers who would like to have full-time jobs but have been forced “for economic reasons” to accept fewer hours. The reserve army of unemployed and underemployed workers then rises to more than 49.54 million—or 31.3 percent of the U.S. labor force.

Moreover, as I argued this past Monday, millions of unemployed workers are not included in this number:

In addition to first-time job-seekers who have unable to find a job (some unknown portion of an estimated 3.8 million high-school graduates, 1 million who graduated with associate’s degrees, and 2 million with bachelor’s degrees), it doesn’t include any of the estimated 8 million undocumented workers who have lost their jobs.

Right now, no one in the White House is offering a real plan for the tens of millions of unemployed and underemployed American workers to be able to pay the rent, purchase health insurance, or get enough to eat.


*I used the following, perhaps overly generous, assumptions: 1 in 2 workers who were unemployed in mid-March have been able to find jobs and 2 in 10 workers who filed initial claims in the past eleven weeks have gone back to work.

**At the highest of levels of unemployment following the 2007-08 crash, there were 15.3 million jobless Americans.

BureauofLaborStatistics-0a868acbc1dd4b67a4f0dcfcb2bf040b

There are lies, there are outrageous lies, and there are statistics.

— Robert Giffen, Economic Journal (1892)

Are U.S. unemployment numbers rigged? Sure, they are!

They’re not rigged in the way Paul Krugman implied last Friday (“This being the Trump era, you can’t completely discount the possibility that they’ve gotten to the BLS”). Or in the way former General Electric CEO Jack Welch suggested back in 2012 (when he asserted that the Obama White House had manipulated the job figures for political gains). Or in the way Donald Trump used to say the unemployment rate was “phony” (“The number is probably 28, 29, as high as 35 [percent]. In fact, I even heard recently 42 percent.”) until, of course, he became president and declared the rising jobs numbers a “blowout” (even though he and his economic advisers used some questionable math) and, most recently, the falling unemployment rate a “great day” (for George Floyd, whom Trump said was “looking down right now and saying this is a great thing that’s happening for our country,” and “for everybody”).

No, the jobs numbers are not manipulated in those ways. They’re rigged—in my view, much more seriously—in terms of the ways the various categories are defined and measured and the manner in which the data are collected. And, of course, the ways values are imputed to the rising and falling numbers.

Let’s start with the last point: why should we believe, as most news outlets and Trump himself proclaimed (including FiveThirtyEight, which declared it “shockingly good”), that the much-publicized recent fall in the official unemployment rate (from 14.7 percent in April to 13.3 percent in May) is a good thing? We’re still in the midst of the COVID-19 pandemic, when workers should be paid to stay home. Instead, they’re being forced to have the freedom to return to selling their ability to work—because their employers want to make profits by hiring them and workers themselves are finding it difficult to get by on unemployment benefits (when, that is, they’ve been able to obtain them). Why is that something we should applaud?

Moreover, even according to the unadjusted numbers, there were still 21 million unemployed American workers in May. Let’s remember that, at the worst point of the Second Great Depression (in October 2009), the highest unemployment rate was 10 percent and the largest number of unemployed workers was 15.4 million.

As for the rest, the first sign there may be a problem with the unemployment numbers is the admission, in the text of the official report from the Bureau of Labor Statistics, that many workers may have been misclassified. Workers who were “employed but absent from work” were supposed to be counted as “unemployed on temporary layoff” but many, it seems, were not.

If the workers who were recorded as employed but absent from work due to “other reasons” (over and above the number absent for other reasons in a typical May) had been classified as unemployed on temporary layoff, the overall unemployment rate would have been about 3 percentage points higher than reported (on a not seasonally adjusted basis).

Fixing that error would raise the official unemployment rate in May to 16.3 percent.

Now, let’s consider what the official statistics mean and don’t mean. This is an exercise I used to do with all of my students, most of whom had no idea how the unemployment numbers were defined and calculated, even after taking many mainstream economics courses.

The official or headline unemployment rate is actually one of 6 rates reported by the Bureau of Labor Statistics, referred to as U-3. To be counted as unemployed according to the U-3 rate, a worker has to (a) have had a job, (b) been laid off from a job, and (c) be actively looking for a new job. (In addition, they’re not counted if they’re in the armed forces, in prison, or undocumented.)

The rates and total numbers of officially unemployed workers, from January 2007 to May 2020, are illustrated in the two charts below.

LNS14000000_390681_1591454536897 LNS13000000_390681_1591454536844

So, who is not included in these numbers? The headline unemployment rate doesn’t include workers (such as high school and college graduates) who are looking for their first jobs. It doesn’t include workers who are involuntarily working at part-time jobs (working any number of hours, including 1 hour a week, counts as “employed”). And it doesn’t include workers who want a job but are “discouraged” and therefore have given up actively looking for a job.

The so-called U-6 rate includes two of those groups, in addition to the unemployed workers that form the U-3 rate: workers who are employed part-time for “economic reasons” and workers who are considered “marginally attached” to the labor force.

rates

As readers can see, the U-6 rate (the green line in the chart above) is always much higher than the U-3 rate (the blue line). In May, it was 21.2 percent, compared to the rate of 13.3 percent that was widely reported in news outlets.

And then there’s the group of 4.8 million workers who were considered misclassified in the most report. Add them all together and the United States actually had a total of 45.4 million workers who were either unemployed or underemployed in May. That’s exactly one-third the size of the entire employed population in the United States.

But that U-6 plus misclassified total still doesn’t adequately capture the dire straits of American workers. In addition to first-time job-seekers who have unable to find a job (some unknown portion of an estimated 3.8 million high-school graduates, 1 million who graduated with associate’s degrees, and 2 million with bachelor’s degrees), it doesn’t include any of the estimated 8 million undocumented workers who have lost their jobs.

The only conclusion is that the official unemployment figures are in fact rigged—not by any particular malfeasance or corrupt intervention into the Bureau of Labor Statistics, but by the way the unemployed are defined, measured, and counted. The reserve army of unemployed and underemployed workers is actually much larger than the figures cited by the White House and widely reported in news outlets.

In the end, what matters for American workers is less that the statistics are biased. It’s more that the prevailing economic institutions in the United States—which use and abuse them as wage-slaves, no more so than during the current pandemic—are rigged against them.

initial claims7

Gambling man rolls the dice, workingman pays the bill
It’s still fat and easy up on banker’s hill
Up on banker’s hill, the party’s going strong…
Down here below we’re shackled and drawn

— Bruce Springsteen, “Shackled and Drawn”

This morning, the U.S. Department of Labor (pdf) reported that, during the week ending last Saturday, another 1.9 million American workers filed initial claims for unemployment compensation. That’s on top of the 40.8 million workers who were laid off during the preceding ten weeks.

Here is a breakdown of each week:

• week ending on 21 March—3.31 million

• week ending on 28 March—6.87 million

• week ending on 4 April—6.62 million

• week ending on 11 April—5.24 million

• week ending on 18 April—4.44 million

• week ending on 25 April—3.87 million

• week ending on 2 May—3.18 million

• week ending on 9 May—2.69 million

• week ending on 16 May—2.45 million

• week ending on 23 May—2.13 million

• week ending on 30 May—1.88 million

All told, 42.65 million American workers have filed initial unemployment claims during the past eleven weeks.

To put that into some kind of perspective, I calculated the initial claims totals for two other relevant 11-week periods: the worst point of the Second Great Depression (encompassing the weeks ending on 24 and 31 January, 7, 14, 21, 28 February, 7, 14, 21, and 28 March, and 4 April 2009) and the weeks immediately preceding the current depression (so, 4, 11, 18, and 25 January, 1, 8, 15, 22, and 29 February and 7 and 14 March 2020).

As readers can see in the chart above, the difference is stunning: 6.5 million workers filed initial claims during the worst 11-week period of 2009, 2.19 million from late January to mid-March of this year, and 42.65 million in the past eleven weeks.

Once again, keep in mind, the most recent numbers still don’t include perhaps millions of other American workers, since many states are still addressing backlogs of claims. Masses of workers have been unsuccessful in applying for unemployment insurance because state websites and phone lines are inundated and still, even now, not working correctly.

Moreover, because they’re only initial claims, the numbers also don’t include the 7.1 million American workers who were deemed officially unemployed in early March, before most of the shutdowns started.

According to the most recent report from the Bureau of Labor Statistics (pdf), the number of unemployed workers rose by 15.9 million to 23.1 million in April, leading to an official unemployment rate of 14.7 percent—”the highest rate and the largest over-the-month increase in the history of the series.” But the surveys on which those data are based only capture those who were unemployed in mid-April.

If we allow for the fact that at least some workers have been forced to have the freedom to return to work in recent months, then the total number of fully unemployed workers is something on the order of 36.2 million.* That would mean an unemployment rate of more than 24.1 percent, which is getting closer and closer to the rate last seen in the first Great Depression (25 percent) and almost two and a half times the highest rate (10 percent) suffered during the Second Great Depression.**

On top of that, we should add in the workers who are involuntarily working part-time jobs—in other words, workers who would like to have full-time jobs but have been forced “for economic reasons” to accept fewer hours. The reserve army of unemployed and underemployed workers then rises to more than 48.5 million—or 31 percent of the U.S. labor force.

Moreover, as Patricia Cohen reminds us, millions of unemployed workers are not included in these numbers:

Laid-off workers who have not applied for benefits and those who have left the labor force entirely are not included. Nor are any of the eight million undocumented workers who lost their jobs. They are not eligible for any benefits. Neither are new graduates just entering the labor force.

Right now, no one in the White House is offering a real plan for the tens of millions of unemployed and underemployed American workers to be able to pay the rent, purchase health insurance, or get enough to eat.


*I used the following, perhaps overly generous, assumptions: 1 in 2 workers who were unemployed in mid-March have been able to find jobs and 2 in 10 workers who filed initial claims in the past eleven weeks have gone back to work.

**At the highest of levels of unemployment following the 2007-08 crash, there were 15.3 million jobless Americans.

initial claims 5

But really we can’t even say we
Have no explanation
For that would injure us gravely
Not being the way to win

— Bertolt Brecht, “The unemployment, gentlemen. . .”

This morning, the U.S. Department of Labor (pdf) reported that, during the week ending last Saturday, another 2.98 million American workers filed initial claims for unemployment compensation. That’s on top of the 33.48 million workers who were laid off during the preceding seven weeks.

Here is a breakdown of each week:

• week ending on 21 March—3.31 million

• week ending on 28 March—6.87 million

• week ending on 4 April—6.62 million

• week ending on 11 April—5.24 million

• week ending on 18 April—4.44 million

• week ending on 25 April—3.85 million

• week ending on 2 May—3.17 million

• week ending on 9 May—2.98 million

All told, close to 36.5 million American workers have filed initial unemployment claims during the past eight weeks.

To put that into some kind of perspective, I calculated the initial claims totals for two other relevant eight-week periods: the worst point of the Second Great Depression (encompassing the weeks ending on 14, 21, 28 February, 7, 14, 21, and 28 March, and 4 April 2009) and the weeks immediately preceding the current depression (so, 25 January, 1, 8, 15, 22, and 29 February and 7 and 14 March 2020).

As readers can see in the chart above, the difference is stunning: 5.23 million workers filed initial claims during the worst eight-week period of 2009, 1.76 million from late January to mid-March of this year, and 36.49 million in the past eight weeks.

Once again, keep in mind, the most recent numbers still don’t include perhaps millions of other American workers, since many states are still addressing backlogs of claims. Masses of workers have been unsuccessful in applying for unemployment insurance because state websites and phone lines are inundated and still not working correctly.

Moreover, because they’re only initial claims, the numbers also don’t include the 7.1 million American workers who were deemed officially unemployed in early March, before most of the shutdowns started.

According to the most recent report from the Bureau of Labor Statistics (pdf), the number of unemployed workers rose by 15.9 million to 23.1 million in April, leading to an official unemployment rate of 14.7 percent—”the highest rate and the largest over-the-month increase in the history of the series.” But the surveys on which those data are based only capture those who were unemployed in mid-April.

If we allow for the fact that at least some workers have been forced to have the freedom to return to work in recent months, then the total number of fully unemployed workers is something on the order of 33 million.* That would mean an unemployment rate of around 21 percent, which is getting closer and closer to the rate last seen in the first Great Depression (25 percent) and twice the highest rate (10 percent) experienced during the Second Great Depression.**

On top of that, we should add in the workers who are involuntarily working part-time jobs—in other words, workers who would like to have full-time jobs but have been forced “for economic reasons” to accept fewer hours. The army of unemployed and underemployed workers then rises to something on the order of 44 million—or 28 percent of the U.S. labor force.


*I used the following, perhaps overly generous, assumptions: 1 in 2 workers who were unemployed in mid-March have been able to find jobs and 2 in 10 workers who filed initial claims in the past two months have gone back to work.

**At the highest of levels of unemployment following the 2007-08 crash, there were 15.3 million jobless Americans.

labor share

You know things are bad—and going to get worse—when a mainstream newspaper like the Washington Post invokes the Mohr:

What Karl Marx once called “the reserve army of the unemployed” will probably keep wage growth in check as the recovery inches forward.

Despite the inverted commas, Marx never used that exact phrase. He referred to an “industrial reserve army” or “relative surplus population” (in chapter 25 of volume 1 of Capital), which he saw as both a result and a condition of capitalist growth.

The course characteristic of modern industry, viz., a decennial cycle (interrupted by smaller oscillations), of periods of average activity, production at high pressure, crisis and stagnation, depends on the constant formation, the greater or less absorption, and the re-formation of the industrial reserve army or surplus population. In their turn, the varying phases of the industrial cycle recruit the surplus population, and become one of the most energetic agents of its reproduction.

In particular, the existence of a reserve army serves to discipline labor, keeping its wage demands in check, since employed workers are forced to compete with unemployed and underemployed workers for the available jobs.

For my part, I have variously used the terms “reserve army of the unemployed,” “reserve army of the unemployed and underemployed,” and “reserve army unemployed, underemployed, and low-wage workers” to get at much the same issue. And, as is clear from the chart at the top of the post, the reserve army has played its role: since 2000, the index of the labor share of national income in the United States (the blue line, with 2007 equal to 100) has fallen from 108.2 to 96.7. Moreover, the trendline (the red line, which I fitted to the data with a fifth degree polynomial) not only shows a precipitous decline since the turn of the century, but also very little movement during the so-called recovery from the Second Great Depression.

And that’s when the unemployment rate had fallen as low as 3.5 percent (in February of this year). Now it has skyrocketed—to 14.7 percent according to the official rate and at least 24.9 percent according to my own calculations. The tens of millions of new layoffs from the pandemic shutdown have clearly swelled the ranks of the reserve army, as well as the newly impoverished attempting to register for unemployment compensation and waiting in lines outside food banks, in the United States.

We don’t know yet how large the reserve army will actually get, which will depend both on new hires (as some firms continue to operate and even expand or attempt to reopen, to return to making profits) and new layoffs (as other firms go under, either never reopening or being acquired by other firms that have survived).

According to a recent study by Jose Maria Barrero, Nick Bloom, and Steven J. Davis, the COVID-19 shock caused 3 new hires in the near term for every 10 layoffs. However, they also estimate, based on survey evidence and historical evidence of how layoffs relate to recalls, that 42 percent of recent pandemic-induced layoffs will result in permanent job loss.

What that means is the reserve army of unemployed and underemployed workers will continue to increase in the coming months. As a result, I expect the trend of the labor share, which had already started falling prior to the pandemic, to continue to decline.

The way the American economy is currently configured, private employers will only start to hire workers and decrease the reserve army when it is profitable to do so. And workers will be at the mercy of those decisions and, as a result, continue to lose out on an aggregate level to their opposite number, the corporations that alone control hiring decisions.

As Marx wrote,

The folly is now patent of the economic wisdom that preaches to the labourers the accommodation of their number to the requirements of capital. . .The first word of this adaptation is the creation of a relative surplus population, or industrial reserve army. Its last word is the misery of constantly extending strata of the active army of labour, and the dead weight of pauperism.

That would only change in the United States today if the economy were transformed, for example, by a government jobs program (such as the United States implemented during the first Great Depression, with the Works Progress Administration) or by allowing workers to have a say in hiring decisions (either by occupying seats on the boards of directors of existing corporations or by expanding the number of worker-owned enterprises).

Only with such changes would the reserve army be absorbed, the ranks of the newly impoverished decrease, and the trend in the labor share of national income turn around and start to rise.

jobs-day-public-sector.png

While much of the discussion of austerity has recently been about Greece, the United States has been enduring its own version of austerity: through declines in public-sector employment.

As the Economic Policy Institute explains,

public sector jobs are still nearly half a million down from where they were before the recession began. Moreover, this fails to account for the fact that we would have expected these jobs to grow with the population–taking that into consideration, the economy is short 1.8 million public sector jobs.

This shortfall in public sector jobs not only removes the multiplier effect on private sector demand, it also swells the ranks of the unemployed and underemployed, thereby increasing the downward pressure on workers’ wages.

employment gap

Mainstream economists have, it seems, rediscovered what we’ve known since at least the middle of the nineteenth century: capitalism produces a relative surplus population of unemployed and unemployed workers. And that surplus of labor puts downward pressure on workers’ wages.

Back then it was called the “industrial reserve army.” I have referred to it since 2010 as the “reserve army of the underemployed.” David G. Blanchflower and Andrew T. Levin now point to the same phenomenon in terms of the “employment gap,” that is, the combination of conventional unemployment (individuals who did have a job, are now not working at all, and are actively searching for a job), underemployment (that is, people working part time who want a full-time job), and hidden unemployment (people who are not actively searching but who would rejoin the workforce if the job market were stronger).

What Blanchflower and Levin find is instructive.

First, the conventional unemployment rate has not served as an accurate reflection of the evolution of labor market slack.

it is evident that the U.S. economic recovery remains far from complete in spite of apparently reassuring recent signals from the conventional unemployment rate. Indeed, while the unemployment gap has become quite small, the incidence of underemployment remains elevated and the size of the labor force remains well below CBO’s assessment of its potential. In particular, the employment gap currently stands at 1.9 percent, suggesting that the “true” unemployment rate (including underemployment and hidden unemployment) should be viewed as around 71⁄2 percent. Gauged in human terms, the current magnitude of the employment shortfall is equivalent to about 3.3 million full-time jobs.

Second, in recent years, wage growth has been pushed down by a combination of the unemployment rate, the nonparticipation rate, and the underemployment rate. In particular,

we suspect that the wage curve is relatively flat at elevated levels of labor market slack, i.e., a decline in slack does not generate any significant wage pressures as long as the level of slack remains large. As noted above, our benchmark analysis indicates that the true unemployment rate is currently around 71⁄2 percent—a notable decline from its peak of more than 10 percent but still well above its longer-run normal level of around 5 percent. Thus, the shape of the wage curve can explain why nominal wage growth has remained stagnant at around 2 percent over the past few years even as the employment gap has diminished substantially. Moreover, our interpretation suggests that nominal wages will not begin to accelerate until labor market slack diminishes substantially further and and the true unemployment rate approaches its longer-run normal level of around 5 percent.

In other words, what Blanchflower and Levin have discovered is that there is a large relative surplus population of workers and that the existence of such a reserve army has a dampening effect on workers’ wages.

Now, all they need to do is discover a third component of what we’ve known since the Mohr wrote back in 1867: “The labouring population therefore produces, along with the accumulation of capital produced by it, the means by which it itself is made relatively superfluous, is turned into a relative surplus population; and it does this to an always increasing extent. This is a law of population peculiar to the capitalist mode of production”

CBPP-fig3

source

This one gets filed under “what &%*@#! recovery?” or, if you prefer, “why we’re still in the Second Great Depression.”

It shows that, while the official unemployment has dropped from a high of 10 percent in October 2009 to 7.4 percent in today’s release by the Bureau of Labor Statistics, the percentage of working-age adults with jobs has barely moved.

As Ezra Klein explains,

At the beginning of 2007, the employment rate was 63.3 percent, and the unemployment rate was 4.7 percent. By the end of 2009—so, after the worst of the recession—it had fallen to 58.3 percent, and unemployment was up to 9.9 percent. Today, it’s 58.7 percent, even though unemployment has fallen to 7.6 [today: 7.4] percent. That means a lot of the people who’ve left the rolls of the unemployed haven’t gotten a new job. They’ve just left the labor force altogether.

And no wonder: few jobs are being created, and the new jobs available tend to be in low-wage sectors such as retail sales and food services and drinking places, not manufacturing or health services or other major industries (such as mining and logging, construction, transportation and warehousing, and government).

All of which adds up to the fact that, while the stock market and corporate profits have certainly recovered, there is no recovery for everyone else. That means the Reserve Army of the Barely Employed, the Underemployed, and the Unemployed continues to grow.