Archive for October, 2014

lives

The third part of “Children of the Recession,” UNICEF’s report on “the impact of the economic crisis on child well-being in rich countries,” focuses on Gallup Poll data about people’s experiences and perceptions of the most recent crisis of capitalism.*

In 18 of the 41 countries, three or more of these indicators reveal rising feelings of insecurity and stress from 2007 to 2013. The most severely affected countries—including the United States—are clustered at the bottom of the table.

In terms of its impact on personal experiences and perceptions, the Second Great Depression is certainly not over. In 13 countries—again, including the United States—negative responses to three or four questions were still rising between 2011 and 2013, particularly in countries such as Cyprus, Greece, Ireland, Israel, the Netherlands, Spain and Turkey.


*Due to data availability, the numbers in the table refer to the population in general, not to families with children. Countries are ranked based on their average score across the four indicators, each of which measures how responses changed between 2007 and 2013. The highest number indicates the sharpest change. Column 5 indicates how many of the responses to the four were negative over the full period.

10-31-14-USM-cuts-4 10-31-14-USM-cuts-3

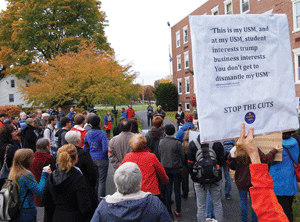
This past Wednesday, faculty and students protested budget cuts and layoffs at University of Southern Maine, calling the reductions an attack on the university and on Maine’s economy.

Layoffs occurred in multiple departments including computer science and economics, the Maine Education Association reported, spurring a press conference on the Portland campus Wednesday.

Paul Christiansen, associate professor of musicology, told a crowd outside Payson Smith Hall, “I’ve been at USM for nine years, I’ve been tenured for three years, I’ve been fired by voicemail, and I’m supposed to get a letter sometime today by I guess express mail. Pretty pathetic.”

Christiansen said his position’s elimination will affect students.

“How will music undergraduate and graduate students be able to graduate without the music history courses that I’ve been teaching here since I’ve been here?” he asked. “How will they be able to graduate without a PhD teaching these courses? And I was the only music historian not only at USM but in the entire University of Maine system.”

Prefacing his comments with the remark, “Well, here we go again,” Christiansen noted that cuts have buffeted the university over the entire year. He said the impacts will be felt outside the halls of higher education.

“This is even worse for the entire state of Maine. They’re destroying USM and this comprehensive public university that serves the economic and cultural center of the state,” Christiansen said.

“There’s an utter lack of vision or leadership among these administrators. It’s mere bean counting, not higher education,” he said.

Rachel Bouvier, associate professor of economics, said her layoff notice led to gifts of chocolates and flowers from students, but she urged them to go beyond commiserating. She urged students to share their stories about the value of the economics department and professors’ role in their education.

“You need to tell your stories to the legislators, and you need to tell your stories to the community. You need to tell them that your education is not just about a diploma, it’s not just about a degree,” Bouvier said.

Relationships with faculty and the experience at USM also play an important role in a student’s development, she said. “My beloved, beautiful, bright students, I hope that I will be able to be part of your future,” Bouvier said, holding out hope that the cuts might be reversed.

“We are not a diploma mill, we are educating our students,” she said.

38bb81f0-5ddd-11e4-897f-00144feabdc0

Wide disparities in broadband access in the United States—between urban and rural areas and especially within cities—are both a consequence and a condition of inequality.

As the Financial Times explains,

It had been thought that the rural make-up of much of the US was the main factor in a national broadband subscription rate that is just 73.4 per cent, behind other developed nations such as the UK and Germany, which have rates of 88 per cent. About 67 per cent of households in rural areas have broadband internet service, compared to 75 per cent of urban households.

But the new Census Bureau statistics show a huge disparity among US cities and towns, with a gap of 65 percentage points between those with the highest and lowest subscription rates.

The problem is most acute in urban areas where the typical cost for the most basic broadband packages is too expensive for some. The OECD ranks the US 30th out of 33 countries for affordability, with an average price of $44 a month, compared with $26 for the UK., $22 for Greece and $16 for South Korea, based on speeds of 2.5 Mbps. . .

There is a very strong correlation with race and income. Just 45 per cent of households with an income of less than $20,000 a year have broadband whereas the rate for those earning $75,000 or more is 91 per cent. About a third of African American and Hispanic households are unconnected compared to 20 per cent for white households and 10 per cent for Asian households.


PettJ20141030_low

Special mention

6a0105369e6edf970b01b7c6fd1889970b-800wi B1NJ0NWIAAAsybq

NEET

According to UNICEF, the latest crisis of capitalism has hit 15-24 year olds especially hard, with the number of young people who are not participating in education, employment, or training rising dramatically in many countries. In the European Union 7.5 million young people (almost equal to the population of Switzerland) were classified as NEET in 2013—nearly a million more than in 2008.

The largest absolute increases were in Croatia, Cyprus, Greece, Italy, and Romania, all with relative changes of around 30 per cent or higher.

Of the OECD countries that are not in the European Union, the United States saw the largest increase in the NEET rate (from 12 to 15 percent), followed by Australia (9.9 to 12.2 percent).

As the authors of the UNICEF report explain,

Unemployment among adolescents and young adults is a significant long-term effect of the recession. Among those aged 15–24, unemployment has increased in 34 of the 41 countries analysed. Youth unemployment and underemployment have reached worrying levels in many countries.

Even when unemployment or inactivity decreases, that does not necessarily mean that young people are finding stable, reasonably paid jobs. The number of 15- to 24-year-olds in part-time work or who are underemployed has tripled on average in countries more exposed to the recession. Contract work has become more common, contributing to the general precariousness of labour markets.

These young people, because of the conditions of unemployment and precarious employment that have been imposed on them, constitute a lost generation

155423_600

Special mention

wuc141028-6052_605  cartoon29102014

child-poverty

A new UNICEF report shows that 2.6 million children have sunk below the poverty line in the world’s most affluent countries since 2008, bringing the total number of children in the developed world living in poverty to an estimated 76.5 million.*

In 23 of the 41 countries analyzed, child poverty has increased since 2008. In Ireland, Croatia, Latvia, Greece, and Iceland, rates rose by over 50 per cent.

In the United States, the overall poverty rate for children rose from an already high 30.1 percent in 2008 to 32.2 percent in 2012.

The report also explains that, in recent decades, the social safety net in the United States has favored the working poor more than the out-of-work poor. Thus, for example,

Among those at or below 100 per cent of the poverty threshold, a large decrease in earned income and TANF in 2010 is offset by large increases in food stamps and the EITC. There was also a modest increase in unemployment insurance. For this group as a whole, the increase in child poverty was lower during this recession than it was in 1982.

For those at or below 50 per cent of the poverty threshold – the extreme poor – the story is somewhat different. Panel B still shows a large decrease in earned income and TANF and a large increase in food stamps, but it also shows a much smaller increase in the EITC and a slight decline in unemployment insurance, in contrast with the situation of the regular poor.

This highlights how the United States safety net has changed to provide more support for poor working families and less for the extreme poor with no work. As a result, extreme child poverty has also increased more in this recession than in the recession of 1982, indicating that the safety net was stronger for the poorest children 30 years ago.


*The UNICEF report uses a fixed reference point, anchored to the relative poverty line in 2008, as a benchmark against which to assess the absolute change in child poverty over time. This change is calculated by computing child poverty in 2008 using a poverty line fixed at 60 per cent of median income. Using the same poverty line in 2012, adjusted for inflation, the rate is computed and the difference in the two rates is shown. A positive number indicates an increase in child poverty. (Using a relative poverty line each year would obscure the impact on poverty of an overall decline in median income. In the United Kingdom, for example, relative child poverty decreased from 24 per cent in 2008 to 18.6 per cent in 2012 due to a sharp decline in median income and the subsequent lowering of the relative poverty line. Using the anchored indicator, it actually increased from 24.0 per cent to 25.6 per cent from the start of the recession.)

10040682_H12600647-600x400

President David Flanagan and Provost Joseph McDonnell of the University of Southern Maine began yesterday to impose the Draconian budget cuts, including faculty and staff layoffs, they had been threatening for weeks.

Twenty-five faculty members have taken an enhanced retirement package, and the remaining 25 people will be laid off this week, USM spokesman Chris Quint said.

Starting Tuesday, deans were notifying the affected faculty members – several by messages left on their voicemail – in their colleges, and USM Provost Joseph McDonnell will send each laid-off faculty member a letter by Friday, Quint said. The layoffs are effective at the end of the semester.

The layoffs include faculty in five academic programs cut by the University of Maine System board of trustees: the master’s program in applied medical sciences, the undergraduate French program, the American and New England studies graduate program, the geosciences major, and the arts and humanities major at USM’s Lewiston campus.

Economics professor Bruce Roberts said his dean notified him that he was losing his job by leaving a phone message while Roberts was teaching a class. Another economics faculty member, associate professor Rachel Bouvier, was also teaching a class Tuesday when the dean left her a similar message, Roberts said. In the message, he told the professors that he was available to meet if they wished.

“One suspects that this was conscious,” said Roberts, who has taught economic theory at USM for 20 years. “If he had actually been on the phone he would have gotten an earful, let me tell you.”

Some of the other laid-off faculty members said they were notified by phone message as well.

Roberts, 66, said he was eligible for retirement but did not take it. Under the contract, all laid-off faculty get 18 months of pay and benefits.

He said the administration’s cuts to the economics department – cutting two of five faculty positions – will ultimately hurt the students.

“I feel terrible for the students,” he said. “This was driven by numbers on a sheet of paper. They don’t give a damn about the students.”

saezfig1

In the United States, we’ve witnessed a return of the Roaring Twenties—for the past three and a half decades.

As Emmanuel Saez and Gabriel Zucman show, the share of wealth (defined as total assets, including real estate and funded pension wealth, net of all debts) held by the top 0.1 percent of families is now almost as high as it was in the late 1920s.

saezfig2

The opposite side of the wealth coin has been an erosion of wealth, beginning in the mid-1980s, among the middle class and the poor. By 2012, the bottom 90 percent of Americans collectively owned only 23 percent of total U.S. wealth, about as much as they owned in 1940.

According to Saez and Zucman,

The growing indebtedness of most Americans is the main reason behind the erosion of the wealth share of the bottom 90% of families. Many middle-class families own homes and have pensions, but too many of these families also have much higher mortgages to repay and much higher consumer credit and student loans to service than before. . .For a time, rising indebtedness was compensated by the increase in the market value of the assets of middle-class families. The average wealth of bottom 90% of families jumped during the stock-market bubble of the late 1990s and the housing bubble of the early 2000s. But it then collapsed during and after the Great Recession of 2007–2009. . .

Since the housing and financial crises of the late 2000s there has been no recovery in the wealth of the middle class and the poor. The average wealth of the bottom 90% of families is equal to $80,000 in 2012 – the same level as in 1986. In contrast, the average wealth for the top 1% more than tripled between 1980 and 2012. In 2012, the wealth of the top 1% increased almost back to its peak level of 2007. The Great Recession looks only like a small bump along an upward trajectory.

How can we explain the growing disparity in American wealth? The answer is that the combination of higher income inequality alongside a growing disparity in the ability to save for most Americans is fuelling the explosion in wealth inequality. For the bottom 90% of families, real wage gains (after factoring in inflation) were very limited over the past three decades, but for their counterparts in the top 1% real wages grew fast. In addition, the saving rate of middle-class and lower-class families collapsed over the same period while it remained substantial at the top. Today, the top 1% families save about 35% of their income, while the bottom 90% families save about zero.

And looking forward?

If income inequality stays high and if the saving rate of the bottom 90% of families remains low then wealth disparity will keep increasing. Ten or 20 years from now, all the gains in wealth democratisation achieved during the New Deal and the post-war decades could be lost. While the rich would be extremely rich, ordinary families would own next to nothing, with debts almost as high as their assets.

To put it differently—and in honor of the season—what we can expect in the future is a tiny group of extremely wealthy vampires continuing to share in a larger and larger share of the blood of living labor, accumulating more and more wealth, while the vast majority wander the economic and social landscape like zombies, being paid the same amount for the work they do and owning next to nothing.

rF5g4.AuSt.79

Special mention

www.usnews 155496_600