U.S. capitalism has a real problem: there don’t seem to be enough workers to keep the economy growing.
And it has another problem: capitalists themselves are to blame for the missing workers.
As is clear from the chart above, the employment-population ratio (the blue line) has collapsed from a high of 64.4 in 2000 to 59 in 2014 (and had risen to only 60.1 by the end of 2017).* During the same period, the average real incomes of the bottom 90 percent of Americans have stagnated—barely increasing from $37,541 to $37,886.
That should be indicator that the problem is on the demand side, that employers’ demand for workers’ labor power has decreased, and not the supply side, that workers are choosing to drop out of the labor force.
But, as I explained back in 2015, that hasn’t stopped mainstream economists from blaming workers themselves—especially women and young people, for being unwilling to work and turning instead to public assistance programs and raising children and being distracted by social media and digital technologies, as well as Baby-Boomers, who are choosing to retire instead of continuing to work.
So, which is it?
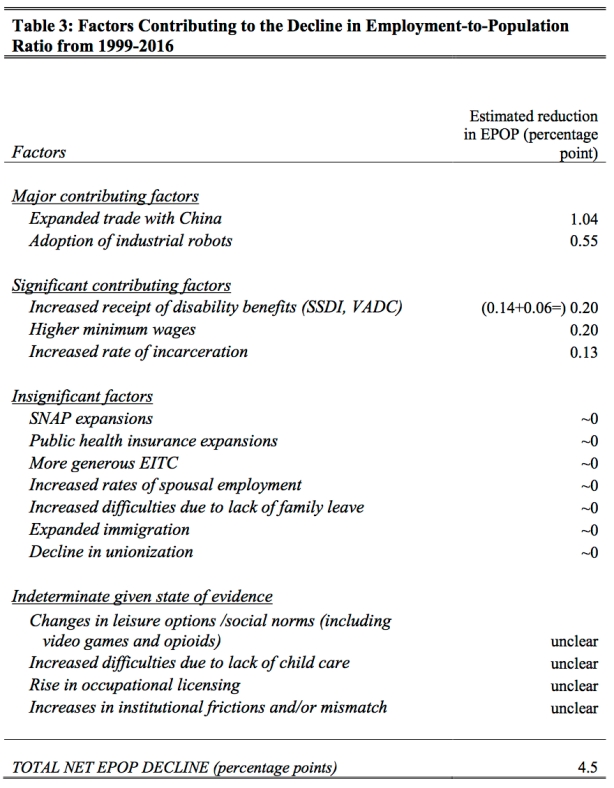
Katharine G. Abraham and Melissa S. Kearney have just completed a study in which they review the available evidence and their conclusion could not be clearer:
labor demand factors, in particular trade and the penetration of robots into the labor market, are the most important drivers of observed within-group declines in employment.
Over the course of the past two decades, U.S. capitalists have decided both to increase trade with China (through outsourcing jobs and importing commodities) and to replace workers with robots and other forms of automation (it is estimated that each robot installed displaces something on the order of 5-6 workers).
That’s the main reason the employment-population ratio has declined so precipitously and that workers’ wages have stagnated in recent years.
Clearly, U.S. capitalists have been remarkably successful at increasing their profits. But they have just as spectacularly failed the vast majority of people who continue to be forced to have the freedom to work for them.
*The Bureau of Labor Statistics defines the employment-population ratio as the ratio of total civilian employment to the 16-and-over civilian noninstitutional population. Simply put, it is the portion of the population that is employed. Thus, for example, in 2000, the total number of civilian employees in the United States was 136.9 million and the figure for the civilian noninstitutional population was 212.6 million. By 2014, the civilian noninstitutional population had grown to 247.9 million but the total number of workers had risen to only 146.3 million. The employment-population ratio differs from both the unemployment rate (the number of unemployed divided by the civilian labor force) and the labor force participation rate (the share of the 16-and-over civilian noninstitutional population either working or looking for work).


[…] have all the workers gone?” (charts) [Occasional Links & Commentary]. “As is clear from the chart above, the employment-population ratio (the blue line) has […]
[…] sont passés tous les travailleurs?" (Graphiques) [ Occasional Links & Commentary ]. "Comme le montre clairement le graphique ci-dessus, le ratio emploi-population (la ligne […]