Posts Tagged ‘underemployment’

initial claims12

Since the first of June,
Lost my job and lost my room.
I pretend to try,
Even though I tried alone.

— Sufian Stevens, “Flint (For the Unemployed and Underpaid)”

Yesterday morning, the U.S. Department of Labor (pdf) reported that, during the week ending last Saturday, another 1.3 million American workers filed initial claims for unemployment compensation. That’s on top of the 48.7 million workers who were laid off during the preceding fifteen weeks.

Here is a breakdown of each week:

• week ending on 21 March—3.31 million

• week ending on 28 March—6.87 million

• week ending on 4 April—6.62 million

• week ending on 11 April—5.24 million

• week ending on 18 April—4.44 million

• week ending on 25 April—3.87 million

• week ending on 2 May—3.18 million

• week ending on 9 May—2.69 million

• week ending on 16 May—2.45 million

• week ending on 23 May—2.12 million

• week ending on 30 May—1.90 million

• week ending on 6 June—1.57 million

• week ending on 13 June—1.54 million

• week ending on 20 June—1.48 million

• week ending on 27 June—1.41 million

• week ending on 4 July—1.31 million

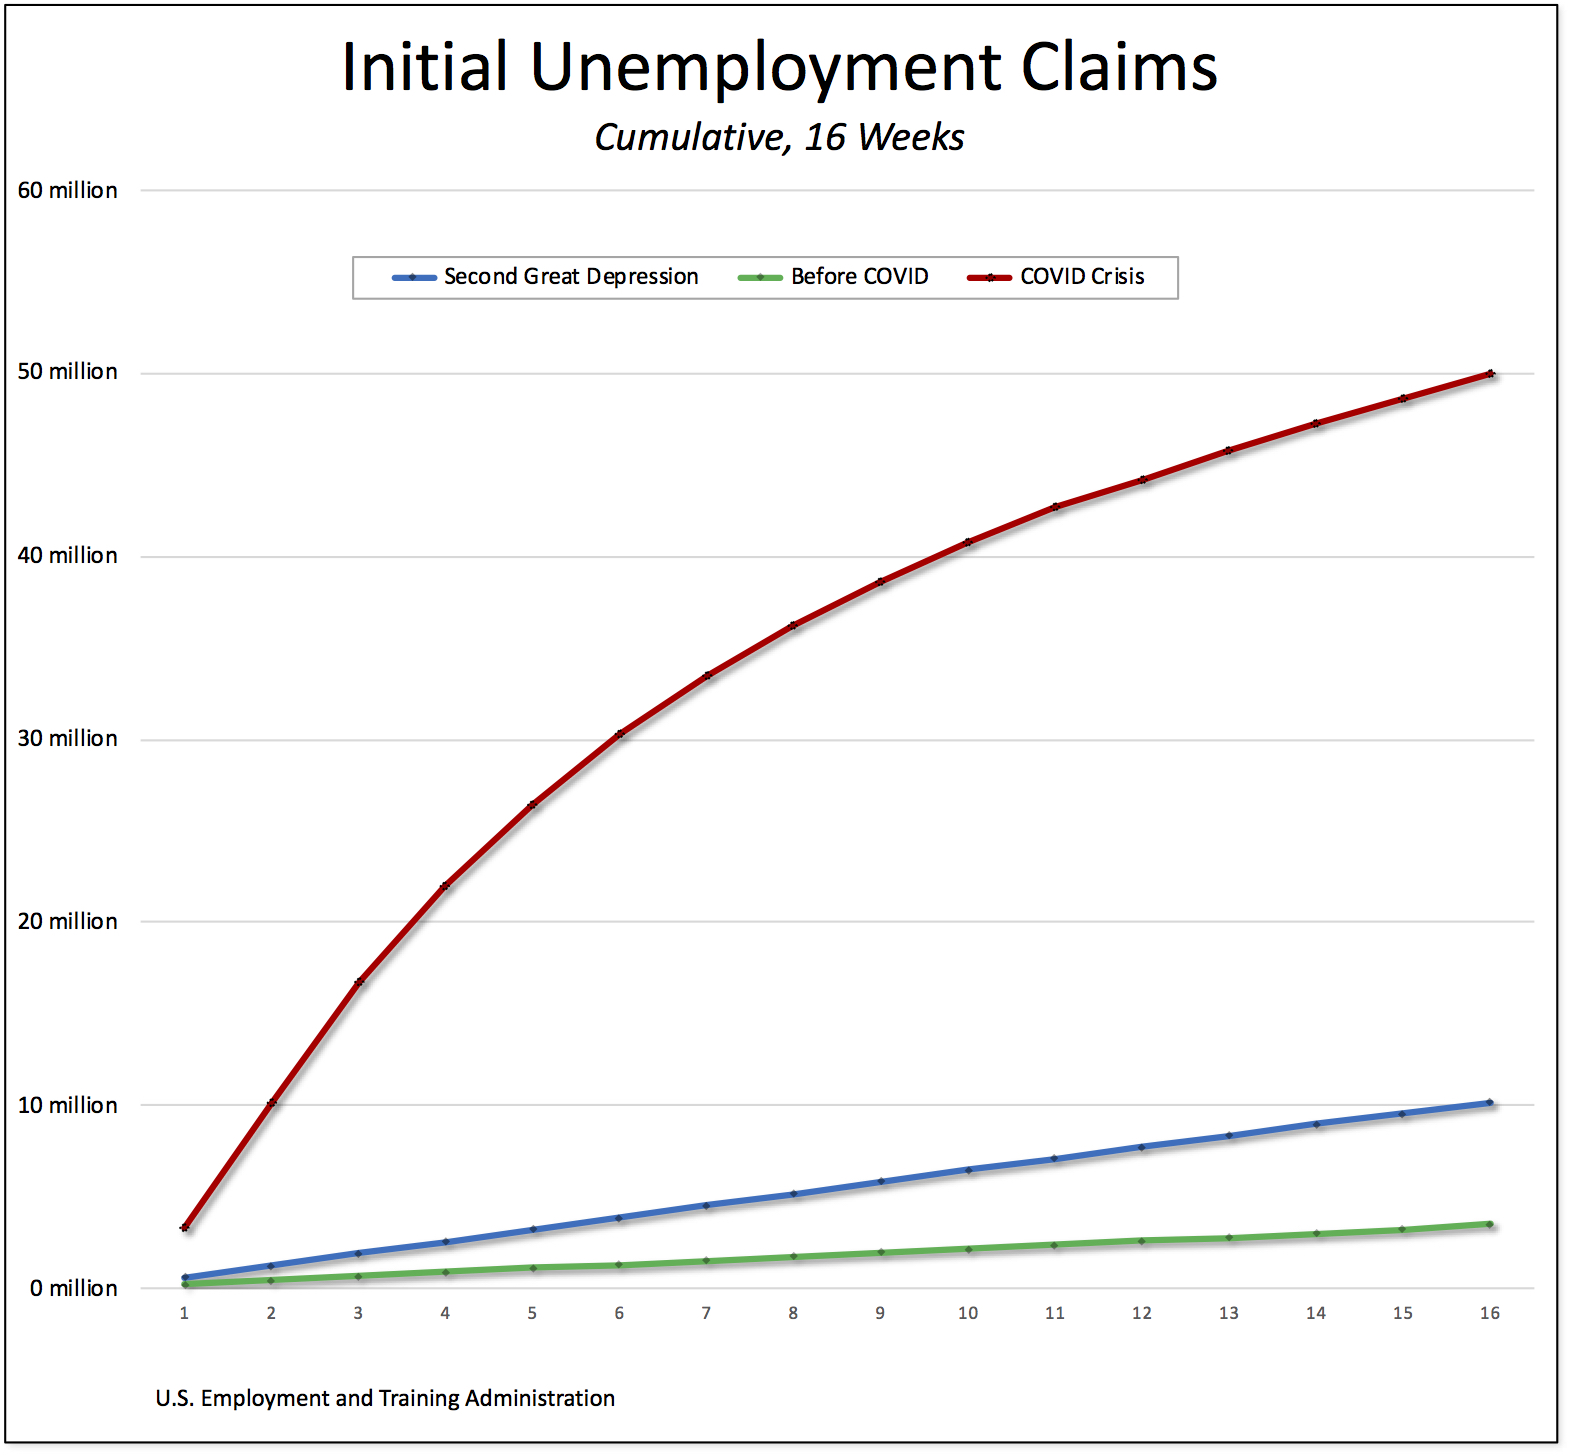
All told, 50 million American workers have filed initial unemployment claims during the past sixteen weeks.

To put that into some kind of perspective, I produced a chart comparing the cumulative totals of the initial unemployment claims for the current pandemic compared to two other relevant periods: the worst point of the Second Great Depression (from the middle of January to early May 2009) and the weeks immediately preceding the current depression (from the end of November 2019 to mid-March 2020).

As readers can see in the chart above, the difference is stunning: 10.2 million workers filed initial claims during the worst 16-week period of 2009, 3.5 million from early December to mid-March of this year, and 50 million in the past sixteen weeks.

According to the most recent report from the Bureau of Labor Statistics, the number of unemployed workers actually fell by 3.2 million to 17.8 million in June, leading to an official unemployment rate of 11.1 percent—although, the surveys on which those data are based only capture those who were unemployed in mid-June, before the new wave of business shutdowns and layoffs.

Moreover, even as the protests ignited a national uprising against racism in the aftermath of the police killing of George Floyd and others, African Americans have experienced the slowest recovery of all racial groups. While the official black unemployment rate in June fell (to 15.4 percent), it is still much higher than the white rate (10.1 percent) and higher even than the Hispanic rate (14.5 percent).

On top of that, we should add in the workers who are involuntarily working part-time jobs—in other words, workers who would like to have full-time jobs but have been forced “for economic reasons” to accept fewer hours—and discouraged workers—Americans who are able to work but have given up looking for a job. The reserve army of unemployed and underemployed workers then rises to something on the order of 30 million Americans.

new-covid-cases-per-million

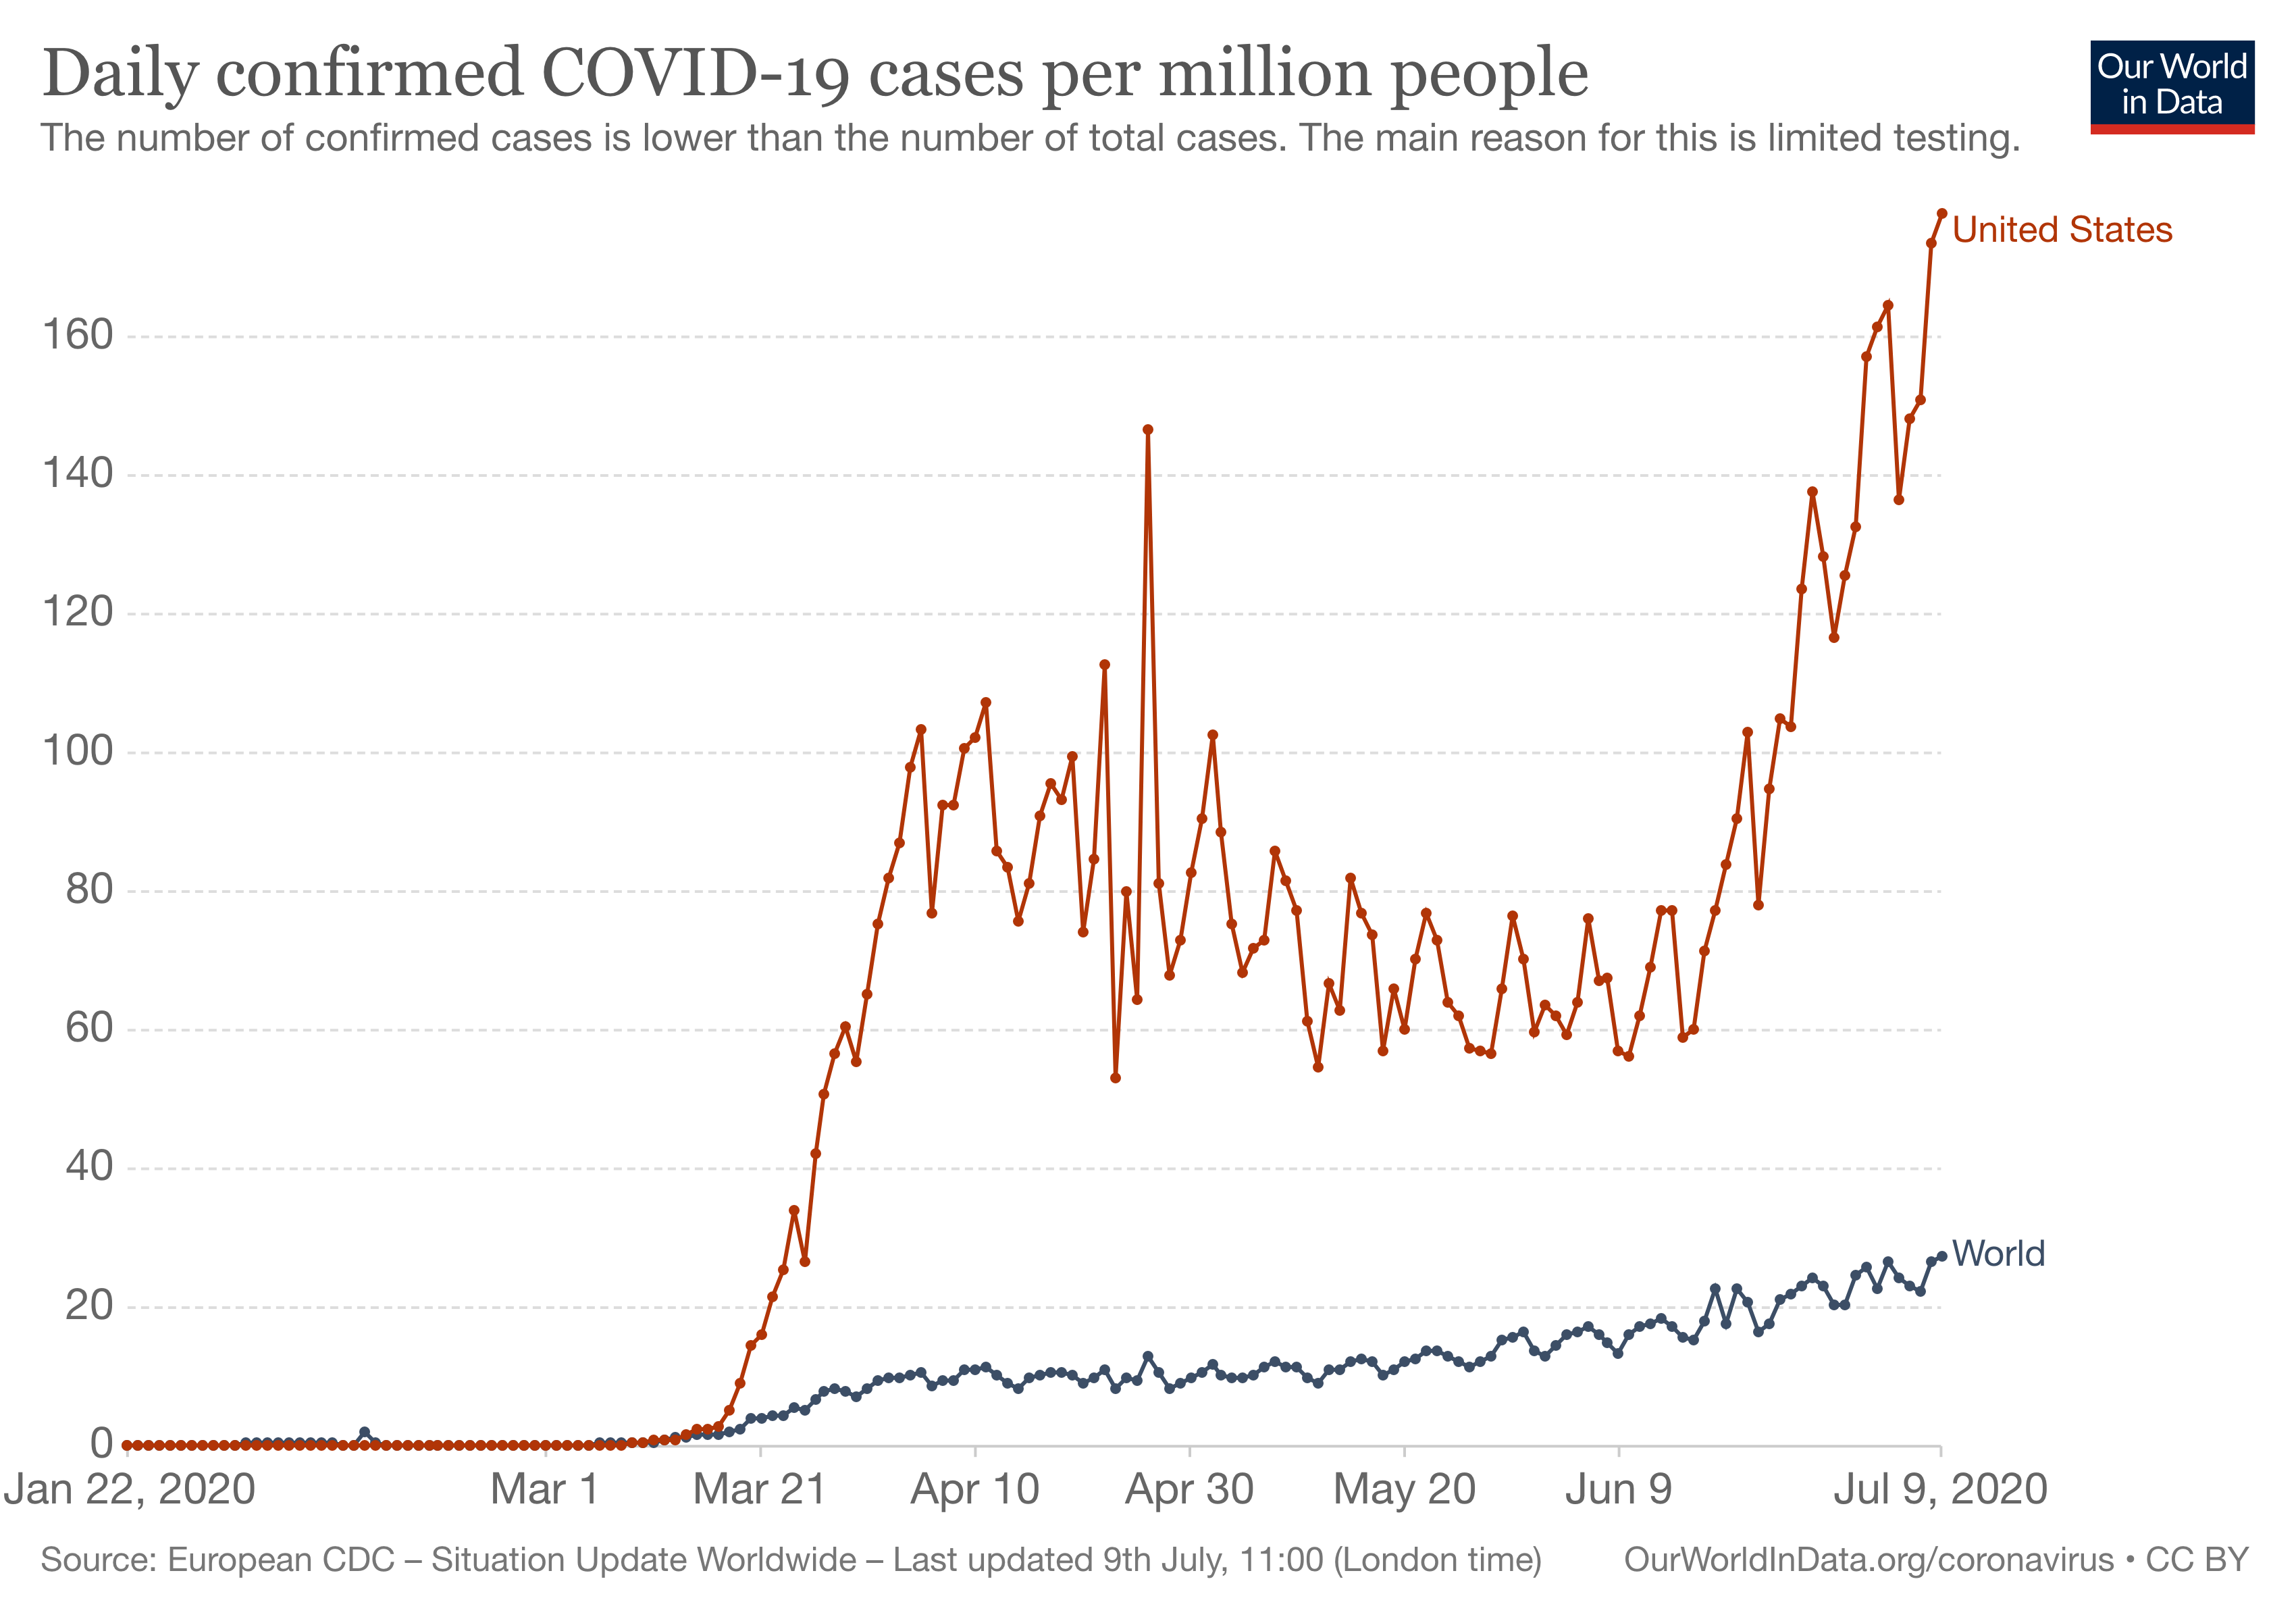
In the meantime, the United States continues to set daily records for new confirmed COVID-19 cases. Yesterday, there were 178 new cases per million people in the United States compared to 27.6 cases for the world as a whole.

We can therefore expect to see new waves of business closures, which in turn will mean more American workers furloughed and laid off, and therefore a steady stream of initial unemployment claims.

The only possible conclusion to draw is that, unless there’s a radical change in the U.S. response, the existing economic and social disaster in the United States will continue to worsen in the weeks and months ahead.

initial claims 11

I’ve got those unemployment compensation
“Please fill out an application” blues.
I’ve got those “How much money did you earn?
Stand in line and wait your turn” blues.

They make me feel I’m committing a sin
Just to get back a little piece of what I put in.
I’ve got those “Have you had an interview?
Come back in a week or two” blues.

— Barbara Dane, “Unemployment Compensation Blues”

Yesterday morning, the U.S. Department of Labor (pdf) reported that, during the week ending last Saturday, another 1.4 million American workers filed initial claims for unemployment compensation. That’s on top of the 47.3 million workers who were laid off during the preceding fourteen weeks.

Here is a breakdown of each week:

• week ending on 21 March—3.31 million

• week ending on 28 March—6.87 million

• week ending on 4 April—6.62 million

• week ending on 11 April—5.24 million

• week ending on 18 April—4.44 million

• week ending on 25 April—3.87 million

• week ending on 2 May—3.18 million

• week ending on 9 May—2.69 million

• week ending on 16 May—2.45 million

• week ending on 23 May—2.12 million

• week ending on 30 May—1.90 million

• week ending on 6 June—1.57 million

• week ending on 13 June—1.54 million

• week ending on 20 June—1.48 million

• week ending on 27 June—1.38 million

All told, 48.68 million American workers have filed initial unemployment claims during the past fifteen weeks.

To put that into some kind of perspective, I calculated the initial claims totals for two other relevant 15-week periods: the worst point of the Second Great Depression (from the end of January to early May 2009) and the weeks immediately preceding the current depression (from early December 2019 to mid-March 2020).

As readers can see in the chart above, the difference is stunning: 9.6 million workers filed initial claims during the worst 15-week period of 2009, 3.3 million from early December to mid-March of this year, and 48.7 million in the past fifteen weeks.

According to the most recent report from the Bureau of Labor Statistics, the number of unemployed workers actually fell by 3.2 million to 17.8 million in June, leading to an official unemployment rate of 11.1 percent—although, the surveys on which those data are based only capture those who were unemployed in mid-June, before the new wave of business shutdowns and layoffs.*

Moreover, even as the protests ignited a national reawakening on racism in the aftermath of the police killing of George Floyd and others, African Americans have experienced the slowest recovery of all racial groups. While the black unemployment rate in June fell (to 15.4 percent), it is still much higher than the white rate (10.1 percent) and higher even than the Hispanic rate (14.5 percent).

daily-covid-cases-per-million-three-day-avg

On top of that, we should add in the workers who are involuntarily working part-time jobs—in other words, workers who would like to have full-time jobs but have been forced “for economic reasons” to accept fewer hours—and discouraged workers—Americans who are able to work but have given up looking for a job. The reserve army of unemployed and underemployed workers then rises to more than 27.8 million Americans.

Moreover, as I argued recently, millions of other unemployed workers are not included in this number:

In addition to first-time job-seekers who have unable to find a job (some unknown portion of an estimated 3.8 million high-school graduates, 1 million who graduated with associate’s degrees, and 2 million with bachelor’s degrees), it doesn’t include any of the estimated 8 million undocumented workers who have lost their jobs.

Meanwhile, employers and the White House (including Labor Secretary Eugene Scalia) are continuing to clamor for businesses to be allowed the freedom to reopen. But they’re worried unemployed workers, who have received supplemental benefits as a result of the CARES act, will not want to return to work under conditions that raise risk of becoming infected with the virus. So, they’ve announced both that the extra $600 “disincentive” for people to return to work will be allowed to expire at the end of July and that any workers who refuse to be called back to work will lose their unemployment benefits.

Their only plan, in the midst of the growing pandemic, is to turn the screws and force more and more American workers—black, brown, and white—to have the freedom to sell their ability to work to someone else.


*Yesterday, the United States set another record for new coronavirus cases. A day after surpassing 50 thousand for the first time, the total hit 55,220. On Wednesday, there were 52,788 new cases.


initial claims10

Hot soup on a campfire under the bridge
Shelter line stretchin’ ’round the corner
Welcome to the new world order
Families sleepin’ in their cars in the Southwest
No home no job no peace no rest

— Bruce Springsteen, “The Ghost of Tom Joad”

Yesterday morning, the U.S. Department of Labor (pdf) reported that, during the week ending last Saturday, another 1.5 million American workers filed initial claims for unemployment compensation. That’s on top of the 45.7 million workers who were laid off during the preceding thirteen weeks.

Here is a breakdown of each week:

• week ending on 21 March—3.31 million

• week ending on 28 March—6.87 million

• week ending on 4 April—6.62 million

• week ending on 11 April—5.24 million

• week ending on 18 April—4.44 million

• week ending on 25 April—3.87 million

• week ending on 2 May—3.18 million

• week ending on 9 May—2.69 million

• week ending on 16 May—2.45 million

• week ending on 23 May—2.12 million

• week ending on 30 May—1.90 million

• week ending on 6 June—1.57 million

• week ending on 13 June—1.54 million

• week ending on 20 June—1.48

All told, 47.25 million American workers have filed initial unemployment claims during the past fourteen weeks.

To put that into some kind of perspective, I calculated the initial claims totals for two other relevant 14-week periods: the worst point of the Second Great Depression (from the end of January to the beginning of May 2009) and the weeks immediately preceding the current depression (from mid-December 2019 to mid-March 2020).

As readers can see in the chart above, the difference is stunning: 9 million workers filed initial claims during the worst 14-week period of 2009, 3.1 million from mid-December to mid-March of this year, and 45.7 million in the past fourteen weeks.

Once again, keep in mind, the most recent numbers still don’t include perhaps millions of other American workers, since many states are still addressing backlogs of claims. Masses of workers have been unsuccessful in applying for unemployment insurance because state websites and phone lines are inundated and still, even now, not working correctly.

According to the most recent report from the Bureau of Labor Statistics, the number of unemployed workers fell by 2.1 million to 21.0 million in May, leading to an official unemployment rate of 13.3 percent—although, by correcting the misclassification of a large number of workers (who were classified as employed but absent from work), the official rate would have been about 3 percentage points higher. Moreover, the surveys on which those data are based only capture those who were unemployed in mid-May.

If we allow for the fact that at least some workers have been forced to have the freedom to return to work in recent months, then the total number of fully unemployed workers is something on the order of 33 million.* That would mean an unemployment rate of more than 21 percent, which is very close to the rate last seen in the first Great Depression (25 percent) and more than twice the highest rate (10 percent) suffered during the Second Great Depression.**

On top of that, we should add in the workers who are involuntarily working part-time jobs—in other words, workers who would like to have full-time jobs but have been forced “for economic reasons” to accept fewer hours. The reserve army of unemployed and underemployed workers then rises to more than 43.5 million.

Moreover, as I argued recently, millions of unemployed workers are not included in this number:

In addition to first-time job-seekers who have unable to find a job (some unknown portion of an estimated 3.8 million high-school graduates, 1 million who graduated with associate’s degrees, and 2 million with bachelor’s degrees), it doesn’t include any of the estimated 8 million undocumented workers who have lost their jobs.

Meanwhile, employers and the White House (including Labor Secretary Eugene Scalia) are continuing to clamor for businesses to be allowed the freedom to reopen. But they’re worried unemployed workers, who have received supplemental benefits as a result of the CARES act, will not want to return to work under with the risk of becoming infected with the virus. So, they’ve announced both that the extra $600 “disincentive” for people to return to work will be allowed to expire at the end of July and that any workers who refuse to be called back to work will lose their unemployment payments.

Their only plan, in the midst of the pandemic, is to turn the screws and force more and more American workers to have the freedom to sell their ability to work to someone else.


*I used the following, perhaps overly generous, assumption: 3 in 10 workers who filed initial claims in the past fourteen weeks have gone back to work. My total is a bit higher than the sum of “continued claims” (19.5 million) and workers receiving Pandemic Unemployment Assistance (11.1 million).

**At the highest of levels of unemployment following the 2007-08 crash, there were 15.3 million jobless Americans.

Initial claims9

They came for him in the morning, before coffee break.

— Stewart O’Nan, The Odds

This morning, the U.S. Department of Labor (pdf) reported that, during the week ending last Saturday, another 1.5 million American workers filed initial claims for unemployment compensation. That’s on top of the 44.2 million workers who were laid off during the preceding twelve weeks.

Here is a breakdown of each week:

• week ending on 21 March—3.31 million

• week ending on 28 March—6.87 million

• week ending on 4 April—6.62 million

• week ending on 11 April—5.24 million

• week ending on 18 April—4.44 million

• week ending on 25 April—3.87 million

• week ending on 2 May—3.18 million

• week ending on 9 May—2.69 million

• week ending on 16 May—2.45 million

• week ending on 23 May—2.12 million

• week ending on 30 May—1.90 million

• week ending on 6 June—1.57 million

• week ending on 13 June—1.51 million

All told, 45.74 million American workers have filed initial unemployment claims during the past thirteen weeks.

To put that into some kind of perspective, I calculated the initial claims totals for two other relevant 13-week periods: the worst point of the Second Great Depression (encompassing the weeks ending on 11, 17, 24, and 31 January, 7, 14, 21, 28 February, 7, 14, 21, and 28 March, and 4 April 2009) and the weeks immediately preceding the current depression (so, 21 and 28 December, 4, 11, 18, and 25 January, 1, 8, 15, 22, and 29 February and 7 and 14 March 2020).

As readers can see in the chart above, the difference is stunning: 8.2 million workers filed initial claims during the worst 13-week period of 2009, 2.8 million from late December to mid-March of this year, and 45.7 million in the past thirteen weeks.

Once again, keep in mind, the most recent numbers still don’t include perhaps millions of other American workers, since many states are still addressing backlogs of claims. Masses of workers have been unsuccessful in applying for unemployment insurance because state websites and phone lines are inundated and still, even now, not working correctly.

According to the most recent report from the Bureau of Labor Statistics, the number of unemployed workers fell by 2.1 million to 21.0 million in May, leading to an official unemployment rate of 13.3 percent—although, by correcting the misclassification of a large number of workers (who were classified as employed but absent from work), the official rate would have been about 3 percentage points higher. Moreover, the surveys on which those data are based only capture those who were unemployed in mid-May.

If we allow for the fact that at least some workers have been forced to have the freedom to return to work in recent months, then the total number of fully unemployed workers is something on the order of 32 million.* That would mean an unemployment rate of more than 20 percent, which is just below the rate last seen in the first Great Depression (25 percent) and twice the highest rate (10 percent) suffered during the Second Great Depression.**

On top of that, we should add in the workers who are involuntarily working part-time jobs—in other words, workers who would like to have full-time jobs but have been forced “for economic reasons” to accept fewer hours. The reserve army of unemployed and underemployed workers then rises to more than 42.6 million—or 27 percent of the U.S. labor force.

Moreover, as I argued recently, millions of unemployed workers are not included in this number:

In addition to first-time job-seekers who have unable to find a job (some unknown portion of an estimated 3.8 million high-school graduates, 1 million who graduated with associate’s degrees, and 2 million with bachelor’s degrees), it doesn’t include any of the estimated 8 million undocumented workers who have lost their jobs.

Meanwhile, employers and the White House (including Labor Secretary Eugene Scalia) are clamoring for businesses to be allowed the freedom to reopen. But they’re worried unemployed workers, who have received supplemental benefits as a result of the CARES act, will not want to return to work under with the risk of becoming infected with the virus. So, they’ve announced both that the extra $600 “disincentive” for people to return to work will be allowed to expire at the end of July and that any workers who refuse to be called back to work will lose their unemployment payments.

Their only plan, in the midst of the pandemic, is to turn the screws and force more and more American workers to have the freedom to sell their ability to work to someone else.


*I used the following, perhaps overly generous, assumption: 3 in 10 workers who filed initial claims in the past thirteen weeks have gone back to work.

**At the highest of levels of unemployment following the 2007-08 crash, there were 15.3 million jobless Americans.

unemployment-wages

Does anyone really need any additional evidence of the lopsided nature of the current recovery?

Employers certainly don’t. They’re managing to hire additional workers, thus lowering the unemployment rate. But they don’t have to pay the workers they hire much more than they were getting before, with wages barely staying ahead of the rate of inflation. As a result, corporate profits continue to grow.

Clearly, what we’re seeing remains a one-sided recovery: employers are getting ahead—and their workers are still being left behind.

According to the latest report from the Bureau of Labor Statistics, total nonfarm payroll employment increased by 164,000 in April, thus reducing the headline unemployment rate to 3.9 percent and the expanded or U6 unemployment rate (which includes, in addition, marginally attached workers and those who are working part-time for economic reasons) to 7.4 percent.* Meanwhile, average hourly earnings of private-sector production and nonsupervisory employees increased by only 5 cents in April—an annual rate of just 2.7 percent (just a bit more than the current inflation rate of 2.5 percent).

Sure, employers complain that they can’t hire the workers they need—persistent gripes that are dutifully reported in the business press. They may even be paying one-time bonuses. But they’re certainly not increasing wages in order to attract the kinds of workers they say they want.

That’s because they don’t have to. Most of the new jobs are being created in sectors—like professional and technical services (an additional 25.8 thousand jobs in April), temporary help services (10.3 thousand), health care (24.4 thousand), machinery (8.4 thousand), and accommodation and food services (18.9 thousand)—where there are plenty of still-underemployed workers to go around. In addition, most of those workers are not represented by unions, and therefore aren’t in a position to negotiate for higher wages.** The decline in government jobs means there’s little competition for the nation’s workers. And employers continue to have the option of automation and offshoring, which also keeps workers’ wages in check.

So, employers in the United States are able to advertise jobs that pay $10, $12, or $20 an hour, which desperate workers are forced to have the freedom to take—because, within the existing set of economic institutions, the alternatives are even worse.

American employers, with their higher profits and new tax cuts, could be paying higher wages. But they’re choosing not to.***

For them, it’s certainly been a beautiful recovery.


*After revisions, job gains in the United States have averaged 208,000 over the last 3 months.

**However, one group of workers without union representation—teachers—have decided to initiate strikes and other work stoppages to respond to cuts in their wages and education budgets. As North Caroline kindergarten teacher Kristin Beller explained, “We are done being the frog that is being boiled.”

***Except, of course, the portion of the surplus they have been distributing to their CEOs.

rs-19081-rectangle

The economic crises that came to a head in 2008 and the massive response—by the U.S. government and corporations themselves—reshaped the world we live in.* Although sectors of the U.S. economy are still in one of their longest expansions, most people recognize that the recovery has been profoundly uneven and the economic gains have not been fairly distributed.

The question is, what has changed—and, equally significant, what hasn’t—during the past decade?

DJCA

Let’s start with U.S. stock markets, which over the course of less than 18 months, from October 2007 to March 2009, dropped by more than half. And since then? As is clear from the chart above, stocks (as measured by the Dow Jones Composite Average) have rebounded spectacularly, quadrupling in value (until the most recent sell-off). One of the reasons behind the extraordinary bull market has been monetary policy, which through normal means and extraordinary measures has transferred debt and put a great deal of inexpensive money in the hands of banks, corporations, and wealth investors.

profits

The other major reason is that corporate profits have recovered, also in spectacular fashion. As illustrated in the chart above, corporate profits (before tax, without adjustments) have climbed almost 250 percent from their low in the third quarter of 2008. Profits are, of course, a signal to investors that their stocks will likely rise in value. Moreover, increased profits allow corporations themselves to buy back a portion of their stocks. Finally, wealthy individuals, who have managed to capture a large share of the growing surplus appropriated by corporations, have had a growing mountain of cash to speculate on stocks.

Clearly, the United States has experienced a profit-led recovery during the past decade, which is both a cause and a consequence of the stock-market bubble.

banks

The crash and the Second Great Depression, characterized by the much-publicized failures of large financial institutions such as Bear Stearns and Lehman Brothers, raised a number of concerns about the rise in U.S. bank asset concentration that started in the 1990s. Today, as can be seen in the chart above, those concentration ratios (the 3-bank ratio in purple, the 5-bank ratio in green) are even higher. The top three are JPMorgan Chase (which acquired Bear Stearns and Washington Mutual), Bank of America (which purchased Merrill Lynch), and Wells Fargo (which took over Wachovia, North Coast Surety Insurance Services, and Merlin Securities), followed by Citigroup (which has managed to survive both a partial nationalization and a series of failed stress tests), and Goldman Sachs (which managed to borrow heavily, on the order of $782 billion in 2008 and 2009, from the Federal Reserve). At the end of 2015 (the last year for which data are available), the 5 largest “Too Big to Fail” banks held nearly half (46.5 percent) of the total of U.S. bank assets.

door.jpg

Moreover, in the Trump administration as in the previous two, the revolving door between Wall Street and the entities in the federal government that are supposed to regulate Wall Street continues to spin. And spin. And spin.

median income

As for everyone else, they’ve barely seen a recovery. Real median household income in 2016 was only 1.5 percent higher than it was before the crash, in 2007.

workers

That’s because, even though the underemployment rate (the annual average rate of unemployed workers, marginally attached workers, and workers employed part-time for economic reasons as a percentage of the civilian labor force plus marginally attached workers, the blue line in the chart) has fallen in the past ten years, it is still very high—9.6 percent in 2016. In addition, the share of low-wage jobs (the percentage of jobs in occupations with median annual pay below the poverty threshold for a family of four, the orange line) remains stubbornly elevated (at 23.3 percent) and the wage share of national income (the green line) is still less than what it was in 2009 (at 43 percent)—and far below its postwar high (of 50.9 percent, in 1969).

Clearly, the recovery that corporations, Wall Street, and owners of stocks have engineered and enjoyed during the past 10 years has largely bypassed American workers.

income

One of the consequences of the lopsided recovery is that the distribution of income—already obscenely unequal prior to the crash—has continued to worsen. By 2014 (the last year for which data are available), the share of pretax national income going to the top 1 percent had risen to 20.2 percent (from 19.9 percent in 2007), while that of the bottom 90 percent had fallen to 53 percent (from 54.2 percent in 2007). In other words, the rising income share of the top 1 percent mirrors the declining share of the bottom 90 percent of the distribution.

wealth

The distribution of wealth in the United States is even more unequal. The top 1 percent held 38.6 percent of total household wealth in 2016, up from 33.7 percent in 2007, that of the next 9 percent more or less stable at 38.5 percent, while that of the bottom 90 percent had shrunk even further, from 28.6 percent to 22.8 percent.

So, back to my original question: what has—and has not—changed over the course of the past decade?

One area of the economy has clearly rebounded. Through their own efforts and with considerable help from the government, the stock market, corporate profits, Wall Street, and the income and wealth of the top 1 percent have all recovered from the crash. It’s certainly been their kind of recovery.

And they’ve recovered in large part because everyone else has been left behind. The vast majority of people, the American working-class, those who produce but don’t appropriate the surplus: they’ve been forced, within desperate and distressed circumstances, to shoulder the burden of a recovery they’ve had no say in directing and from which they’ve been mostly excluded.

The problem is, that makes the current recovery no different from the run-up to the crash itself—grotesque levels of inequality that fueled the bloated profits on both Main Street and Wall Street and a series of speculative asset bubbles. And the current recovery, far from correcting those tendencies, has made them even more obscene.

Thus, ten years on, U.S. capitalism has created the conditions for renewed instability and another, dramatic crash.


*In a post last year, I called into question any attempt to precisely date the beginning of the crises.

L0lwacX

Apparently, “late capitalism” is the term that is being widely used to capture and make sense of the irrational and increasingly grotesque features of contemporary economy and society. There’s even a recent novel, A Young Man’s Guide to Late Capitalism, by Peter Mountford.

A reader [ht: ra] wrote in wanting to know what I thought about the label, which is admirably surveyed and discussed in a recent Atlantic article by Anne Lowrey.

I’ll admit, I’m suspicious of “late capitalism” (like other such catchall phrases), for two main reasons. First, it presumes and invokes a stage theory of development, which relies on identifying certain “laws of motion” of capitalist history. That’s certainly the way Ernest Mandel understood and developed the term—as the latest in a series of necessary stages of capitalist development. For me, the history of capitalism is too contingent and unpredictable to obey such law-like regularity. Second, “late capitalism” is meant to characterize all of a certain stage of economy and society, thereby invoking a notion of totality. Like other such phrases—I’m thinking, in particular, of “globalization,” “empire,” and “neoliberalism”—the idea is that the entire world, or at least what are considered to be its essential elements, can be captured by the term. As I see it, capitalism exists only in some parts of the world, some but certainly not all economic and social spaces, and, even when and where it does exist, it assumes distinct forms and operates in different modalities. Using a term like “late capitalism” tends to iron out all those differences.

So, I’m wary of the notion of “late capitalism,” which for both reasons may lead us astray in terms of making sense of and responding to what is going on in the world today.

At the same time, I remain sympathetic to the idea that “late capitalism” effectively captures at least some dimensions of contemporary economic and social reality. Here in the United States, there’s clearly something late—both exhausted and exhausting—about contemporary capitalism. In the wake of the worst crises since the first Great Depression, growth rates remains low, leaving millions of workers either unemployed or underemployed. Wages continue to stagnate, even as corporate profits and the stock market soar. And the unequal distribution of income and wealth, having become increasingly obscene in recent decades, has ushered in a new Gilded Age.

As Lowrey explains,

“Late capitalism” became a catchall for incidents that capture the tragicomic inanity and inequity of contemporary capitalism. Nordstrom selling jeans with fake mud on them for $425. Prisoners’ phone calls costing $14 a minute. Starbucks forcing baristas to write “Come Together” on cups due to the fiscal-cliff showdown.

And, of course, the election of Donald Trump.

What is less clear is if “late capitalism” carries with it a hint of revolution, whether it contains something akin to the idea that the contradictions of capitalism create the possibility of a radical alternative. Even if contemporary capitalism is exhausted and we, witnessing and being subjected to its absurdities and indignities, are being exhausted by it—that doesn’t mean “late capitalism” will generate the political forces required for its being replaced by a radically different way of organizing economic and social life.

But perhaps that’s asking too much of the concept. If it merely serves to galvanize new ways of thinking, to recommit us to the task of a “ruthless criticism of everything existing,” then we’ll be moving in the right direction.

Greg Kahn

I am quite willing to admit that, based on last Friday’s job report, the Second Great Depression is now over.

As regular readers know, I have been using the analogy to the Great Depression of the 1930s to characterize the situation in the United States since late 2007. Then as now, it was not a recession but, instead, a depression.

As I explain to my students in A Tale of Two Depressions, the National Bureau of Economic Research doesn’t have any official criteria for distinguishing an economic depression from a recession. What I offer them as an alternative are two criteria: (a) being down (as against going down) and (b) the normal rules are suspended (as, e.g., in the case of the “zero lower bound” and the election of Donald Trump).

By those criteria, the United States experienced a second Great Depression starting in December 2007 and continuing through April 2017. That’s almost a decade of being down and suspending the normal rules!

Now, with the official unemployment rate having fallen to 4.4 percent, equal to the low it had reached in May 2007, we can safely say the Second Great Depression has come to an end.

However, that doesn’t mean we’re out of the woods, or that we can forget about the effects of the most recent depression on American workers.*

GDP.jpg

For example, while Gross Domestic Product per capita in the United States is higher now than it was at the end of 2007 ($51,860 versus $49,586, in chained 2009 dollars, or 4.6 percent), it is still much lower than it would have been had the previous trend continued (which can be seen in the chart above, where I extend the 2000-2007 trend line forward to 2017). All that lost output—not to mention the accompanying jobs, homes, communities, and so on—represents one of the lingering effects of the Second Great Depression.

HS  college

And we can’t forget that young workers face elevated rates of underemployment—11.9 percent for young college graduates and much higher, 30.9 percent, for young high-school graduates. As the Economic Policy Institute observes,

This suggests that young graduates face less desirable employment options than they used to in response to the recent labor market weakness for young workers.

income  wealth

Finally, the previous trend of growing inequality—in terms of both income and wealth—has continued during the Second Great Depression. And there are no indications from the economy or economic policy that suggest that trend will be reversed anytime soon.

So, here we are at the end of the Second Great Depression—no longer down and with the normal rules back in place—and yet the effects from the longest and most severe downturn since the 1930s will be felt for generations to come.


*As if often the case, readers’ comments on newspaper articles tell a different story from the articles themselves. Here are two, on the New York Times article about the latest employment data:

John Schmidt—

Any discussion about “full employment”, when there are so many people who’ve essentially given up looking for work or who’re working in low-skill or unskilled labor positions, seems like the fiscal equivalent of rearranging deck chairs on the Titanic. Based on data from the Fed and the World Bank, GDP per capita has doubled since 1993, while median household income has risen ~10%. Most of the newly-generated wealth and gains from productivity increases are being funneled upward, such that the average worker very rarely sees any sort of pay increase. Are we expected to believe that this will change now that we’ve [arguably] passed some arbitrary threshold? Why should we pat ourselves on the back for reaching “full employment”? Shouldn’t we be seeking *fulfilling* employment for everyone, instead, at least inasmuch as that’s possible? Shouldn’t we care that the relentless drive for profit at the expense of everything else is creating a toxic environment where the only way to ensure a raise is to hop from job to job, eroding any sense of two-way loyalty between companies and their employees?

I’m not sure what the solution is, but I know enough to see there’s a problem. Inequality of this sort is not sustainable, and it’s not going to magically disappear without some serious policy changes.

David Dennis—

There is a critical parameter missing from full employment data. very critical. Here in Pontiac, Michigan before the collapse of American manufacturing, full employment meant 10, 000 jobs working at GM factories and Pontiac Motors making above the mean wages with excellent health insurance as well as retirement pensions. You can not compare full employment at McDonalds and Walmart with the jobs that preceded them. The full employment measure doesn’t mean much if it isn’t correlated with a index that compares that employment with a standard of living as it relates to a set basket of goods, services, and benefits.

img_4602_1

In a recently leaked audio file (from a private fundraiser in February), Hillary Clinton referred to them as “children of the Great Recession. . .living in their parents’ basement,” who “feel they got their education and the jobs that are available to them are not at all what they envisioned for themselves. And they don’t see much of a future.”*

Well, as it turns out, the children of the Great Recession, especially those who completed college in recent years, were right: the jobs that have been available to them have not been at all what they envisioned for themselves.

fig1

According to new research by Jaison R. Abel and Richard Deitz, unemployment among all workers, including college graduates, rose sharply during the Great Recession and continued to climb in the early stages of the recovery to levels not seen in decades.** It also increased dramatically for recent college graduates (whom the authors define as those with at least a bachelor’s degree who are 22 to 27 years old), doubling from about 3.5 percent before the recession to a peak of more than 7 percent in 2011. And even while unemployment among recent college graduates began to fall in late 2011, and to decline thereafter, it fell less steeply than for both college graduates as a whole and for all workers.

fig2

But high rates of unemployment only reveal part of the plight of recent college graduates during the second Great Depression. Many of them also found themselves underemployed, that is, working in jobs that did not require a college degree. Not all of them were working as baristas, of course, but their underemployment rate has consistently held well above the rate for all college graduates (which, historically, has hovered at around one-third)—climbing well into 2014, rising to more than 46 percent, a level not seen since the early 1990s. As Abel and Deitz explain,

This divergence between falling unemployment and rising underemployment among recent college graduates between mid-2011 and mid-2014 suggests that more graduates were finding jobs during this time, just not necessarily good ones.

fig3

The fact is, no matter how hard they tried, recent college graduates have had a difficult time finding jobs that met their degrees. That’s because, beginning in 2011, the demand for college jobs has fallen further and further behind postings for non-college jobs. According to the authors,

The steady growth of non-college jobs, coupled with the relatively soft demand for college graduates during this three-year period, appears to have forced many recent college graduates to take jobs not commensurate with their education. With the demand for college graduates rising again beginning in mid-2014, underemployment also started to come down. However, even with this modest improvement, 44.6 percent of college graduates—nearly one in two—found themselves underemployed in the early stages of their careers following the Great Recession.

What’s interesting is that recent college graduates, who were disappointed by the fewer and worse jobs they offered, for which they and their families had accumulated large amounts of student debt, did not choose the safe, mainstream option. They opted for a much-derided “idealism” and supported Sanders in much higher numbers than his self-identified “center-left/center-right” opponent.

For the last few decades, the value of a college degree has been economic and social dogma in the United States. Recent college graduates, who were forced to confront that dogma, were perhaps more prepared then to challenge other dogmas, including the political options presented by the American establishment.


*From Clinton’s perspective, underemployed Millennials’ support for Bernie Sanders betrayed “a deep desire to believe that we can have free college, free healthcare, that what we’ve done hasn’t gone far enough, and that we just need to, you know, go as far as, you know, Scandinavia, whatever that means, and half the people don’t know what that means, but it’s something that they deeply feel.”

**The charts from the Abel and Deitz research paper are updated on the Federal Reserve Bank of New York web site.

banksy-what-next

Over the course of the next month, millions of high-school and college students will be graduating. And, to judge by the circumstances of other young workers these days, the world that awaits them is pretty dismal.

It’s not their fault. They may be gifted and full of energy but the economic stars are aligned against them. Capitalism is failing them.

12075

Consider high-school graduates. According to the Economic Policy Institute, the official unemployment rate is 17.9 percent (compared to an overall rate of 5 percent)—and the underemployment rate (which combines official unemployment with workers who would like a full-time job but can only find part-time work and those who are so discouraged they’ve given up even looking for work) is an extraordinary 33.7 percent.

12078

Even college graduates, whose official unemployment rate is much lower (at 5.6 percent), face a very high underemployment rate (of 12.6 percent). That’s 1 in 8. And that doesn’t even take into consideration college graduates who are forced to have the freedom to take  jobs that don’t even require a college degree (e.g., the young college graduate working as a data-entry clerk).

12087

And there’s the issue of wages if and when they find a job. The real hourly wages for high-school graduates—both young and overall—are no higher today (at $10.66 and $17.11, respectively) than they were at the beginning of 2000 (when they earned $10.86 and $17.01).

12088

Again, college graduates are better off than workers with a high-school degree. But their wages, too, have been stagnant for the past decade and a half. Young college graduates today can expect to earn, on average, about $18.53 an hour today compared to $18.39 in early 2000; while all workers with a bachelor’s degree receive $31.40 an hour today, which is only slightly higher than in 2000 (when it was $29.39).

The usual argument one hears is that young people should be encouraged to go to college, after which they’ll face lower unemployment and receive higher wages.

That’s fine. I’m all in favor of increasing the chances and lowering the barriers for young people to study in the nation’s colleges and universities. But for young people, no matter how much education they’ve managed to obtain, current economic arrangements are failing them.

The members of the Class of 2016, no matter how gifted, have every right to be worried about what’s next.