Posts Tagged ‘India’

In this post, I continue the draft of sections of my forthcoming book, “Marxian Economics: An Introduction.” This, like the previous post, is for chapter 1, Marxian Economics Today.

A Tale of Two Capitalisms

Marxian economists recognize, just like mainstream economists, that capitalism has radically transformed the world in recent decades, continuing and in some cases accelerating long-term trends. For example, the world has seen spectacular growth in the amount and kinds of goods and services available to consumers. Everything, it seems, can be purchased either in retail shops, big-box stores, or online. And, every year, more of those goods and services are being produced and sold in markets.

That means the wealth of nations has expanded. Thus, technically, Gross Domestic Product per capita has risen since 1970 in countries as diverse as the United States (where it has more than doubled), Japan (more than tripled), China (almost ten times), and Botswana (where it has increased by a factor of more than 22).

International trade has also soared during the same period. Goods and services that are produced in once-remote corners of the world find their way to customers in other regions. Both physical commodities— such as smart phones, automobiles, and fruits and vegetables—and services—like banking, insurance, and communications—are being traded on an increasing basis between residents and non-residents of national economies. To put some numbers on it, merchandise trade grew from $318.2 billion dollars in 1970 to $19.48 trillion in 2018. And exports of services have become a larger and larger share of total exports—for the world as a whole (now 23.5 percent, up from 15 percent) and especially for certain countries (such as the United Kingdom, where services account for about 45 percent of all exports, and the Bahamas, where almost all exports are services).

The world’s cities are the hubs of all that commerce and transportation. It should come as no surprise that the urbanization of the global population has also expanded rapidly in recent decades, from about one third to now over half. In 2018, 1.7 billion people—23 per cent of the world’s population— lived in a city with at least 1 million inhabitants. And while only a small minority currently reside in cities with more than 10 million inhabitants, by 2030 a projected 752 million people will live in so-called megacities, many of them located in the Global South.

We’re all aware that, during recent decades, many new technologies have been invented—in producing goods and services as all well as in consuming them. Think of robotics, artificial intelligence, and digital media. And, with them, new industries and giant firms have emerged and taken off. Consider the so-called Big Four technology companies: Amazon, Google, Apple, and Facebook. They were only founded in the last few decades but, as they’ve continued to grow, they’ve become intertwined with the lives of millions of companies and billions of people around the world.

The owners of those tech companies are, to no one’s amazement, all billionaires. When the first Forbes World Billionaires List was published in 1987, it included only 140 billionaires. Today, they number 2825 and their combined wealth is about $9.4 trillion. That works out to be about $3,300,000,000 per billionaire. Their wealth certainly represents one of the great success stories of capitalism in recent decades.

Finally, capitalism has grown in more countries and expanded into more parts of more countries’ economies over the course of the past 40 years. Both large countries and small (from Russia, India, and China to El Salvador, Algeria, and Vietnam) are more capitalist than ever before. As we look around the world, we can see that the economies of rural areas have been increasingly transformed by and connected to capitalist ways of producing and exchanging goods and services. Global value chains have incorporated and fundamentally altered the lives of millions and millions of workers around the world. Meanwhile, areas of the economy that had been formerly outside of capitalism—for example, goods and services provided by households and government—can now be bought and sold on markets and are the source of profits for a growing number of companies.

But, unlike mainstream economists, Marxists recognize that capitalism’s extraordinary successes in recent decades have also come with tremendous economic and social costs.

All that new wealth of nations? Well, it’s been produced by workers that receive in wages and salaries only a portion of the total value they’ve created. The rest, the surplus, has gone to those at the top of the economic pyramid. So, the distribution of income has become increasingly unequal over time—both within countries and for the world economy as a whole.

According to the the latest World Inequality Report, income inequality has increased in nearly all countries, especially in the United States, China, India, and Russia. In other countries (for example, in the Middle East, sub-Saharan Africa, and Brazil), income inequality has remained relatively stable but at extremely high levels.

At a global level, inequality has also worsened. Thus, for example, the top 1 percent richest individuals in the world captured more than twice as much of the growth in income as the bottom 50 percent since 1980. Basically, the share of income going to the bottom half has mostly stagnated (at around 9 percent), while the share captured by the top 1 percent has risen dramatically (from around 16 percent to more than 20 percent).

And it’s no accident. Inequality has increased because the surplus labor performed by workers, in both rich and poor countries, has not been kept by them but has gone to a small group at the top of the national and world economies.

So, we really are talking about a tale of two capitalisms: one that is celebrated by mainstream economists (but only benefits those in the top 1 percent) and another that is recognized by Marxian economists (who emphasize the idea that the growing wealth of nations and increasing inequality are characteristics of the same economic system).

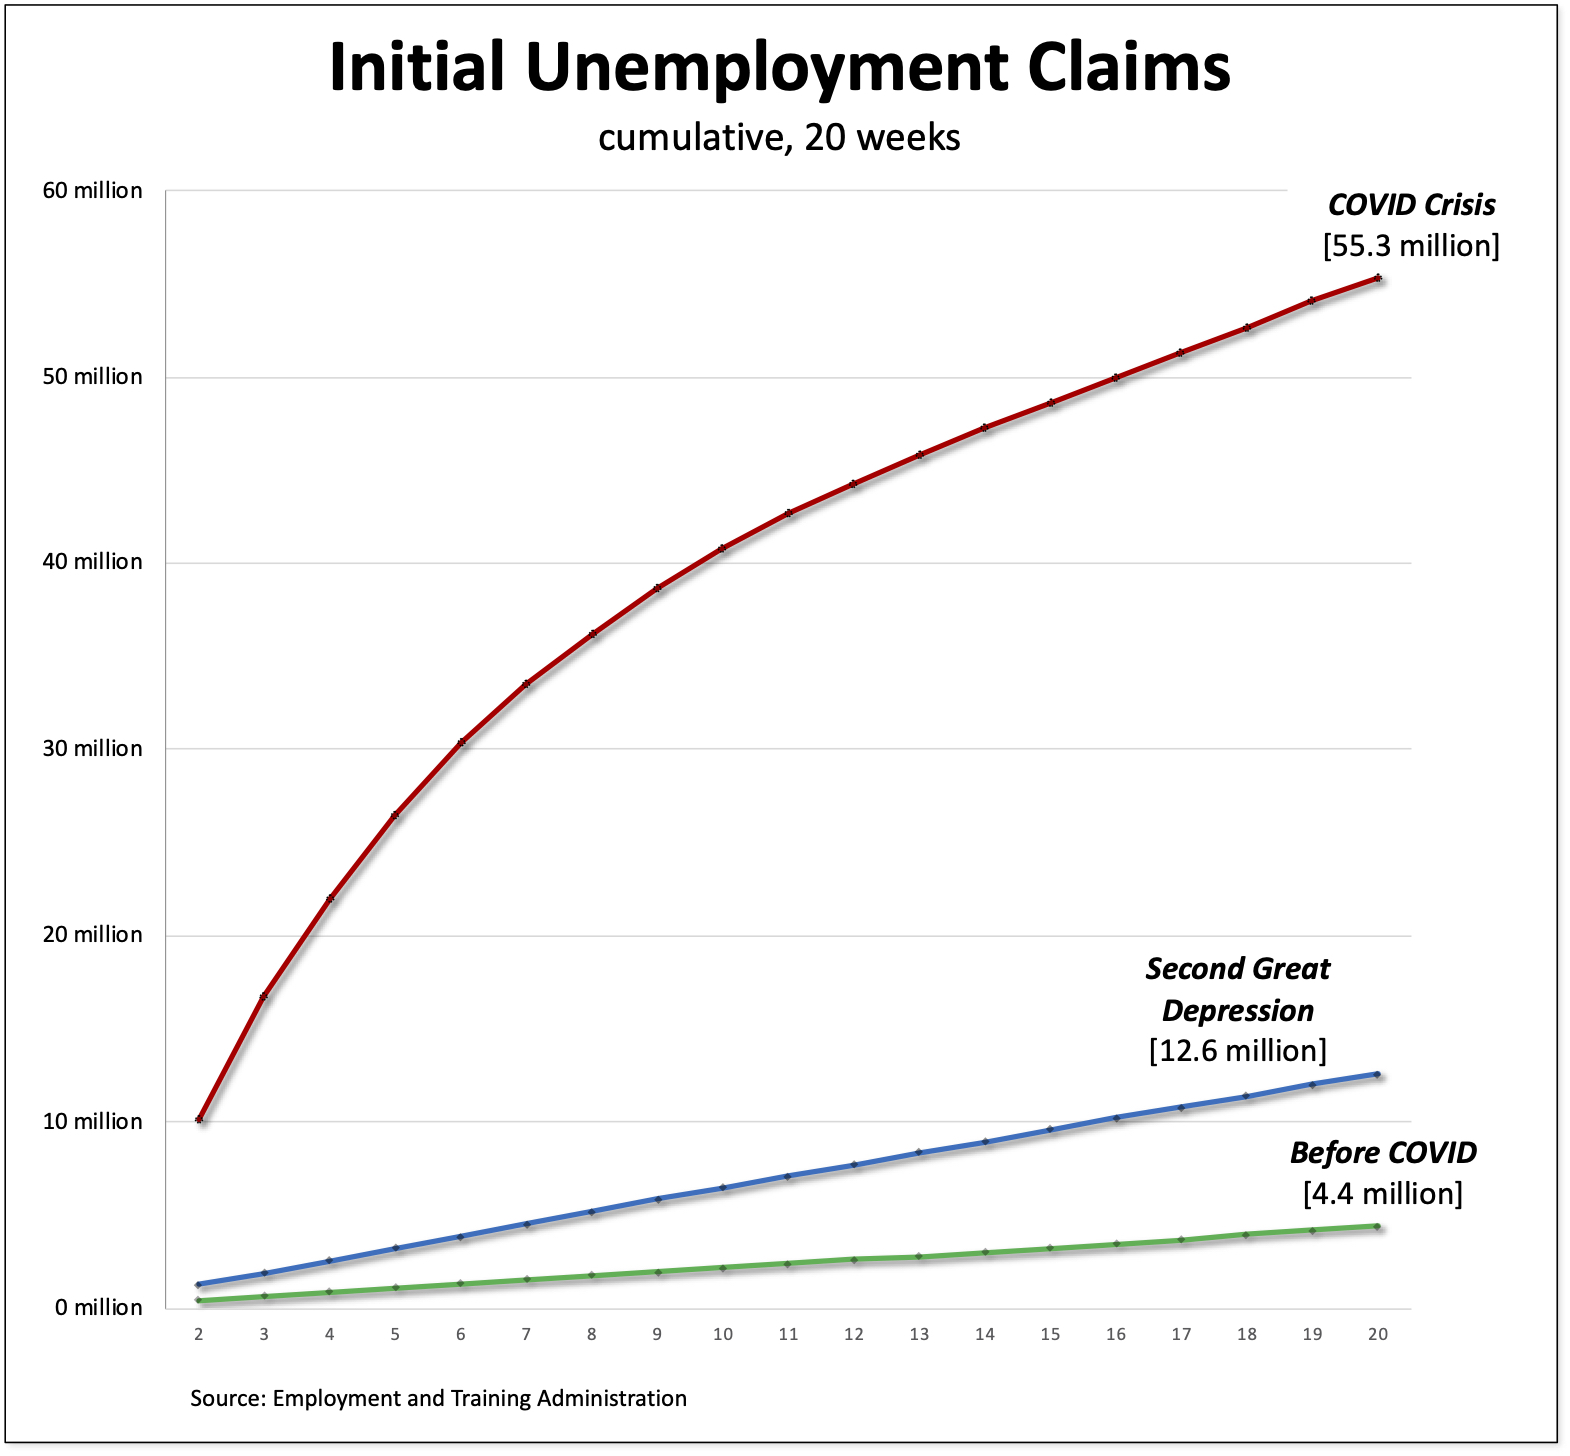
But that’s not the end of the story. All that capitalist growth has been anything but steady. The two most severe economic downturns since the Great Depression of the 1930s have happened in the new millennium: the Second Great Depression (after the crash of 2007-08) and the Pandemic Depression (with the outbreak and spread of the novel coronavirus). In both cases, hundreds of millions of workers around the world were laid off or had their pay cut. Many of them were already struggling to get by, with stagnant wages and precarious jobs, even before economic conditions took a turn for the worse.

And then those same workers had to look up and see one part of the economy recovering—for example, the profits of their employers and shares in the stock market that fueled the wealth of the billionaires—while the one in which they earned their livelihoods barely budged.

Meanwhile, those stunning global cities and urban centers, the likes of which the world has never seen, also include vast slums and informal settlements—parking lots for the working poor. According to the United Nations, over 1 billion people now live in dense neighborhoods with unreliable and often shared access to basic services like water, sanitation and electricity. Many don’t have bank accounts, basic employment contracts, or insurance. Their incomes and workplaces are not on any government agency’s radar.

They’re not so much left behind but, just like their counterparts in the poor neighborhoods of rich countries, incorporated into capitalism on a profoundly unequal basis. They’re forced to compete with one another for substandard housing and low-paying jobs while suffering from much higher rates of crime and environmental pollution than those who live in the wealthy urban neighborhoods. In countries like the United States and the United Kingdom, a disproportionate number are ethnic and racial minorities and recent immigrants.

The working poor in both urban and rural areas are also the ones most affected by the climate crisis. A product of capitalism’s growth, not only in recent decades, but since its inception, global warming has created a world that is crossing temperature barriers which, within a decade, threaten ecosystem collapse, ocean acidification, mass desertification, and coastal areas being flooded into inhabitability.

Meanwhile, the democratic principles and institutions that people have often relied on to make their voices heard are being challenged by political elites and movements that are fueled by and taking advantage of the resentments created by decades of capitalist growth. The irony, of course, is many of these political parties were elected through democratic means and call for more, not less, unbridled capitalism as the way forward.

Clearly, the other side of the coin of capitalism’s tremendous successes have been spectacular failures.

So, it should come as no surprise that there’s more interest these days in both criticisms of and alternatives to capitalism. And Marxian economics is one of the key sources for both: for ways of analyzing capitalism that point to these and other failures not as accidents, but as intrinsic to the way capitalism operates as a system; and for ideas about how to imagine and create other institutions, fundamentally different ways of organizing economic and social life.

Young people, especially, have become interested in the tradition of Marxian economics. They’re trying to pay for their schooling, find decent jobs, and start rewarding careers but they’re increasingly dissatisfied with the effects of the economic system they’re inheriting. Mainstream economics seems to offer less and less to them, especially since it has mostly celebrated and offered policies to strengthen that same economic system. Or, within more liberal parts of mainstream economics, offer only minor changes to keep the system going.

Marxian economics offers a real alternative—in terms of criticizing capitalism and the possibility of creating an economic system that actually delivers longstanding promises of fairness and justice.

initial claims-20

The total number of initial unemployment claims for unemployment compensation in the United State continues to rise.

This morning, the U.S. Department of Labor (pdf) reported that, during the week ending last Saturday, another 1.19 million American workers filed initial claims for unemployment compensation. That means initial jobless claims exceeded one million for the twentieth week in a row.

Here is a breakdown of each week:

• week ending on 21 March—3.31 million

• week ending on 28 March—6.87 million

• week ending on 4 April—6.62 million

• week ending on 11 April—5.24 million

• week ending on 18 April—4.44 million

• week ending on 25 April—3.87 million

• week ending on 2 May—3.18 million

• week ending on 9 May—2.69 million

• week ending on 16 May—2.45 million

• week ending on 23 May—2.12 million

• week ending on 30 May—1.90 million

• week ending on 6 June—1.57 million

• week ending on 13 June—1.54 million

• week ending on 20 June—1.48 million

• week ending on 27 June—1.41 million

• week ending on 4 July—1.31 million

• week ending on 11 July—1.31 million

• week ending on 18 July—1.42 million

• week ending on 25 July—1.44 million

• week ending on 1 August—1.19 million

All told, 55.3 million American workers have filed initial unemployment claims during the past twenty weeks.

To put that into  perspective, I produced the chart above comparing the cumulative totals of the initial unemployment claims for the current pandemic compared to two other relevant periods: the worst point of the Second Great Depression (from mid-January to late May 2009) and the weeks immediately preceding the current depression (from early November 2019 to late March 2020).

As readers can see, the differences are stunning: 12.6 million workers during the Second Great Depression, 4.4 million in the period just before the COVID crisis, and more than 55 million in the past twenty weeks.

And now that emergency federal benefits have expired, the unemployed—both continuing cases and newly laid-off workers—will not be receiving the $600-a-week supplement that helped them pay their bills through the spring and early summer.

daily-covid-cases-per-million-three-day-avg

In the meantime, at least 1,253 new coronavirus deaths and 53,726 new cases were reported in the United States. As of this morning, more than 4,832,400 Americans have been infected with the coronavirus and at least 158,500 have died. The three-day rolling average of new cases per million people in the country was 157 compared to 31 cases for the world as a whole.

We can therefore expect to see new waves of business closures, which in turn will mean more American workers furloughed and laid off, and therefore a steady stream of initial unemployment claims, in the weeks and months ahead.

As Vijay Prashad [ht: ja] has explained,

The incompetence of the Trump administration—mirroring the dangerous incompetence of Jair Bolsonaro of Brazil and Narendra Modi of India—coming on top of a destroyed public health system and a failed private sector testing establishment has condemned millions of people in the U.S. to catch the disease and pass it on. There is—thus far—no prospect of breaking the chain of infection in the United States.

Jbug39V

It should perhaps come as no surprise that, as capitalism has been called into question and socialism generated increasing interest during the past decade, capitalism’s defenders have resorted to a long historical view. Look, they say, how capitalist growth has decreased poverty and led to improvements in people’s lives around the globe. Just stick with it and all will eventually be well.

That’s why, as Jason Hickel points out, the above infographic, based on sketchiest of data going back to 1820, is one of Bill Gates’s favorites. Or why Deirdre McCloskey never tires in scolding the critics of capitalism that “the Great Fact of modern life, the most surprising secular news since the domestication of plants and animals, is the rise of real income per head.”

The past two centuries of economic growth have done more to help the world’s poor than any activity by governments or charities or trade unions.

There are problems, of course, in the data—especially in basing the key series on an absurdly low poverty line of $1.90 a day.* Perhaps even more important, as Hickel explains, the numbers obscure the actual historical process:

that the world went from a situation where most of humanity had no need of money at all to one where today most of humanity struggles to survive on extremely small amounts of money. The graph casts this as a decline in poverty, but in reality what was going on was a process of dispossession that bulldozed people into the capitalist labour system, during the enclosure movements in Europe and the colonisation of the global south.

The masses people who were bulldozed into the capitalist labor system now produce and consume the immense accumulation of commodities that represents the growing wealth of nations around the world.**

But even as the percentage of workers living in extreme poverty has declined, especially in recent decades, they’re falling further and further behind the tiny group at the top. That’s because the incomes generated by economic growth on a global scale have been unevenly distributed.

e4

As the authors of the World Inequality Report 2018 have shown, while the real incomes of the bottom 50 percent of the world’s population increased (by 94 percent) from 1980 to 2016, they only captured a relatively small share (about 12 percent) of total growth during that period—while the world’s elite (whose incomes increased by 101 percent) captured more than twice that share (27 percent).***

What about those countries, such as China and India, where most of the decline in the population living in extreme poverty took place? There, the differences in total cumulative income growth was even more obscene. In China, for example, the incomes of the bottom 50 percent grew by less than 420 percent, while those of the top increased by 1920 percent. And in India, the growing gap between the bottom 50 percent and the top 1 percent is even more stark: just over 100 percent versus 857 percent.

That spectacular growth in inequality on a global scale is the part of the story the current defenders of capitalism such as Gates and McCloskey don’t want to tell. Yes, the percentage of the world’s population living in extreme poverty (at least according to conventional measures) has fallen. But that growing mass of wage-workers has been enlisted, forcibly or otherwise, in the project of producing a surplus that has been captured not by them, but by a tiny group at the top.

In other words, extreme poverty may have fallen but relative immiseration has proceeded apace—the result of a growing gap between those who have a lot and those who now have a little.

As I see it, declining poverty and growing inequality are two sides of the same historical coin of the growth of capitalism on a global scale.


*As Lant Pritchett has explained,

The exclusive reporting of international poverty based on the penurious “dollar a day” poverty line (morphed by inflation into the less lyrical “$1.90 a day” line) was a tool for “defining development down”. . .

A low bar poverty line necessarily treats both people just above the poverty line and people in considerable comfort and prosperity as “not poor” and hence necessarily creates false equivalences in which those just above and just below a poverty line were considered to be different (one “poor” and one “not poor”) but two people above the poverty line with very different incomes were treated the same (both “not poor”).

**I made much the same argument back in 2016:

global capitalism has changed over its history. At one time (especially in the nineteenth century), it meant industrialization in the global north and deindustrialization in the mostly noncapitalist global south (which were, in turn, transformed into providers of raw materials, which became cheap commodity inputs into northern capitalist production). Later, especially after decolonization (following World War II), we saw the beginnings of capitalist development in the south (under the aegis of the state, with a set of policies we often refer to as import-substitution industrialization), which involved a reindustrialization of the south (producing consumer goods that were previously imported) and a change in the kinds of industry prevalent in the north (which both exported consumer goods to the rest of the world, which after the first Great Depression and world war were once again growing, and often provided inputs into the production of consumer goods elsewhere). Later (especially from the 1980s onward), with the accumulation of capital in India, China, Brazil, and elsewhere, noncapitalist economies were disrupted and millions of peasants and rural workers (and their children) were forced to have the freedom to sell their ability to work in urban factories and offices. As a result, their monetary incomes rose (which is not to say their conditions of life necessarily improved), which is reflected in the growing elephant-body of the global distribution of income.

***And, for the middle 40 percent (mostly in North America and Western Europe), the growth in real incomes was much lower (only 43 percent).

E4

One of the most important stories I read, but did not write about, while I was away was the launch of the World Inequality Report 2018.*

The authors of the report confirm what Branko Milanovic and others had previously discovered: that a representation of the unequal gains in world economic growth in recent decades looks like an elephant. Thus, the real incomes of the bottom 50 percent of the world’s population (except the poorest, at the very bottom) have increased, the incomes of those in the middle (especially the working-class in the United States and Western Europe) have decreased, and the global top 1 percent has captured an outsized portion of world economic growth since 1980.**

As I explained back in 2016, the “elephant curve” makes sense of some of the significant changes within global capitalism:

At one time (especially in the nineteenth century), [capitalist globalization] meant industrialization in the global north and deindustrialization in the mostly noncapitalist global south (which were, in turn, transformed into providers of raw materials, which became cheap commodity inputs into northern capitalist production). Later, especially after decolonization (following World War II), we saw the beginnings of capitalist development in the south (under the aegis of the state, with a set of policies we often refer to as import-substitution industrialization), which involved a reindustrialization of the south (producing consumer goods that were previously imported) and a change in the kinds of industry prevalent in the north (which both exported consumer goods to the rest of the world, which after the first Great Depression and world war were once again growing, and often provided inputs into the production of consumer goods elsewhere). Later (especially from the 1980s onward), with the accumulation of capital in India, China, Brazil, and elsewhere, noncapitalist economies were disrupted and millions of peasants and rural workers (and their children) were forced to have the freedom to sell their ability to work in urban factories and offices. As a result, their monetary incomes rose (which is not to say their conditions of life necessarily improved), which is reflected in the growing elephant-body of the global distribution of income.

But that’s not the real elephant in the world. The big issue that everyone is aware of, but nobody wants to talk about, is the obscene degree of economic inequality in the United States.

E10

As it turns out, if the global distribution of income in the future followed the trajectory set by the United States, inequality would significantly increase. As is clear in the chart above, the share of income going to the top 1 percent would rise dramatically (from less than 21 percent today to close to 28 percent of global income by 2050) and that of the bottom 50 percent would fall off precipitously (from approximately 10 percent today to close to 6 percent).

The grotesque level of inequality in the United States—now and as it worsens looking forward, with stagnant wages and enormous tax cuts for large corporations and wealthy individuals—is the real elephant in the world.


*The World Inequality Report, created by the World Inequality Labis the latest in a series of major surveys of the world economy, which includes the World Bank’s World Development Report (beginning in 1978), the International Monetary Fund’s World Economic Outlook (beginning in 1980, first published annually, then biannually), and the United Nation’s Human Development Report (beginning in 1990). Each, of course, uses a different lens to make sense of what is going on in the world economy.

**The elephant curve combines two different scaling methods of the horizontal axis: one by population size (meaning that the distance between different points on the x-axis is proportional to the size of the population of the corresponding income group), the other by the share of growth captured by income group (such that the distance between different points on the x-axis is proportional to the share of growth captured by the corresponding income group), as in the charts below:

A1

A2

billionaires

The timing could not have been better, at least for me. It just so happens I’m teaching Thorsten Veblen’s Theory of the Leisure Class this week. It should become quickly obvious to students that, as I have argued before on this blog, we’re now in the midst of a Second Gilded Age.

This is confirmed in a new report by UBS/PwC, according to which, after a brief pause in 2015, the expansion in billionaire wealth around the world has resumed.

Thus, billionaire wealth rose 17 percent in 2016 (up from $5.1 trillion to $6 trillion), far more than the 5.8-percent nominal GDP growth figure and double the rate of the MSCI AC World Index.** There was also a 10-percent rise in the number of billionaires globally to 1,542. Despite a period of heightened geopolitical uncertainty, the world’s ultrawealthy are flourishing.

The United States still has the world’s largest concentration of billionaire wealth. It grew by 15 percent from $2.4 trillion to $2.8 trillion as billionaires prospered, far outstripping the MSCI AC World Index. Thirty-nine Americans entered the billion-dollar plus wealth band and 14 dropped off.

asian

Europe’s billionaire population was static in 2016. Twenty-four entered this wealth band, while 21 dropped off.*** There were 342 European billionaires at the end of 2016.

The biggest jump occurred in Asia. Three quarters of the newly minted billionaires are from the region’s two biggest economies—China and India. China had by far the highest number, adding a net 67 to total 318. India’s billionaire population climbed 16 to 100. Taken together, the wealth of Asian billionaires grew by almost a third (31 percent) in 2016, up from $1.5 trillion to $2 trillion.

So, what do the world’s billionaires do with their vast wealth? Most of it is used to capture even more income and wealth. Thus, the 1,542 billionaires in the UBS/PwC database own or partly own companies that directly employ at least 27.7 million people worldwide—roughly the same as the UK’s working population. And, via an array of financial instruments and “club deals,” they manage to siphon off a large part of the surplus created by the rest of the global working-class.****

sports

Apparently, the world’s billionaires are also becoming major patrons of sports, such as football (both global and American), hockey, baseball, and basketball. According to the report, more than 140 of the top sports clubs globally are owned by just 109 billionaires.*****

One European entrepreneur explains why he owns a sports club in the following way. “Sport is my life and my dearest hobby,” he says. “Further, the publicity you get from the broadcasting is global. The business works according to the theme ‘you win on Sunday and sell on Monday.’ People always identify themselves with winners. A er all, I not only sponsor, whatever I do in this eld must be sustainable and needs to make commercial sense.”

It should come as no surprise that Veblen held a quite different view:

Addiction to athletic sports, not only in the way of direct participation, but also in the way of sentiment and moral support, is, in a more or less pronounced degree, a characteristic of the leisure class; and it is a trait which that class shares with the lower-class delinquents, and with such atavistic elements throughout the body of the community as are endowed with a dominant predaceous trend.

Clearly, the Gilded Age today shares with its historical predecessor a “dominant predaceous trend” that enables the world’s billionaires to accumulate more and more wealth and leaves the rest of us behind.


*The title of this post is from the collection of short stories by Mark Twain and Charles Dudley Warner, published in 1873. Apparently, the name chosen by Twain and Warner was inspired by William Shakespeare’s The Life and Death of King John (Act 4, Scene 2):

Therefore, to be possess’d with double pomp,
To guard a title that was rich before,
To gild refined gold, to paint the lily,
To throw a perfume on the violet,
To smooth the ice, or add another hue
Unto the rainbow, or with taper-light
To seek the beauteous eye of heaven to garnish,
Is wasteful and ridiculous excess.

**The MSCI AC World Index is a market capitalization weighted index designed to provide a broad measure of equity-market performance throughout the world. It is maintained by Morgan Stanley Capital International, and is comprised of stocks from both developed and emerging markets.

***Germany, Europe’s largest economy, also has the most billionaires, at 117. The United Kingdom comes a distant second, at 55, followed by Italy (42), France (39) and Switzerland (35).

****One high-profile example of clubbing together occurred when Warren Buffett’s Berkshire Hathaway group backed the ill-fated Kraft Heinz $143-billion bid for Unilever in February 2017. Buffett has a record of helping the 3G private equity vehicle behind the bid to finance its deals. 3G is controlled by Jorge Paolo Lemann, Brazil’s richest man, and his partners. Buffett has added his financial firepower to 3G’s acquisitions of doughnut chain Tim Hortons as well as Kraft Heinz.

*****The Glazer family, worth an estimated $4.7 billion in 2015, controls 83 percent of my own favorite sports team.

20161115_134433

Alessandro Portelli, “Harlan County/Kolkata” (November 2016)

by Alessandro Portelli [ht: db] at Jadavpur University in Kolkata

polyp_cartoon_rich_poor_neoliberal

To read National Public Radio’s [ht: ja] article on the latest World Bank report on Poverty and Shared Prosperity: Taking on Inequality, you’d think the problem of global poverty was well on the way to being solved.

Is that just wishful thinking?

In terms of the headline numbers, the author of the article is correct:

In 2013, fewer than 800 million people lived on less than $1.90 a day. That’s less than 11 percent of the global population. As recently as 1990, about 35 percent of all people lived in such extreme poverty.

That means about 1.1 billion people rose out of extreme poverty.

But, before we get too excited, there are 3 key issues to keep in mind.

First, the World Bank itself follows the presentation of the numbers with a note of caution:

Although this represented a noticeable decline, the poverty rate remains unacceptably high given the low standard of living implied by the $1.90-a-day threshold.

That’s right. The threshold is a miserly $1.90 a day, an update taking into account inflation of the previous limit of $1 a day. If they used anything more reasonable—say, an absolute level of $5 a day or, even better, a relative level of 50 percent of mean income—the level of global poverty would be much higher.*

top-incomes

Second, while it’s never mentioned in the article, the actual focus on the World Bank report is inequality. And there the results are, at first glance, bewildering: global inequality has fallen while average within-country inequality is greater now than 25 years ago. But it can be easily explained: Rising incomes in China and India alone, given the size of their populations, have led to a reduction in between-country inequality. However, in many countries, the income share of the top income groups has been expanding—in the United States, of course, but also in Argentina, India, the Republic of Korea, Taiwan, and China. And in South Africa, the top income share roughly doubled over 20 years, to levels comparable to those observed in the United States!

Finally, we need to understand what is actually causing the reported declines in global poverty and inequality. The World Bank singles out five countries—Brazil, Cambodia, Mali, Peru, and Tanzania—as the best performers. And here the NPR article is just plain wrong. The policies the World Bank itself cites are the following “building blocks of success”:

prudent macroeconomic policies, strong growth, functioning labor markets, and coherent domestic policies focusing on safety nets, human capital, and infrastructure.

This is exactly what one would expect from the World Bank: more growth—in other words, business as usual—will solve the problems of poverty and inequality.

The Peruvian example (based on reading the World Bank report and the background research papers) is particularly instructive. The “remarkable” improvement in living conditions among the poor and bottom 40 percent mostly occurred through the labor market (which explains about three-quarters of the reduction in extreme poverty).

What does that mean? Extreme poverty in Peru declined because more people, men and women, joined the labor market. Some left rural areas and migrated to cities; others exited the informal sector and went to work for larger enterprises. In both cases, more Peruvians were forced to have the freedom to sell their ability to work to someone else and, as a result, received more cash income in the form of wages—and then, of course, could use those wages to purchase more commodities.

So, as far as the World Bank is concerned, more Adam Smith development—a faster growing wealth of the nation—was both a condition and consequence of expanding the labor market and reducing poverty. The World Bank’s much-vaunted “shared prosperity” is just another name for more markets and more people working to make profits for a tiny group of employers at the top.

That’s the key point the article missed and the reason the World Bank, in the report, is so keen on celebrating the progress toward achieving the goal of eliminating extreme poverty by 2030.


*In fact, in a World Bank research paper, Shaohua Chen and Martin Ravallion (pdf), compared absolute and relative measures and found “a simultaneous rise in the numbers of relatively poor, alongside the fall in absolute poverty.”


Protest of the day

Posted: 11 September 2016 in Uncategorized
Tags: , , , ,

indianstrike

During the past couple of weeks, the only real India economic news in the Western press was the decision by “the Ranbir Kapoor of banking,” Raghuram G. Rajan, to step down from his position as the head of the Reserve Bank of India.

But we read almost nothing about the 2 September nationwide strike by 150 million Indian workers [ht: Magpie], which was certainly the largest strike in India’s long labor history—and may have been the largest general strike in world history.

As Vijay Prashad explained,

Few front page stories, fewer pictures of marching workers outside their silent factories and banks, tea gardens and bus stations. The sensibility of individual journalists can only rarely break through the wall of cynicism built by the owners of the press and the culture they would like to create. For them, workers’ struggles are an inconvenience to daily life. It is far better for the corporate media to project a strike as a disturbance, as a nuisance to a citizenry that seems to live apart from the workers. It is middle-class outrage that defines the coverage of a strike, not the issues that move workers to take this heartfelt and difficult action. The strike is treated as archaic, as a holdover from another time. It is not seen as a necessary means for workers to voice their frustrations and hopes. The red flags, the slogans and the speeches — these are painted with embarrassment. It is as if turning one’s eyes from them would somehow make them disappear.

billionaires

According to a new study, The Geography of the Global Super-Rich, by Richard Florida, Charlotta Mellander, and Isabel Ritchie, the United States is home to the world’s largest number of billionaires, with 541, 30 percent of the total. China is second with 223 or 12 percent. Next in line are India and Russia, with 82 billionaires (4.5 percent) each. Germany is fifth with 78 billionaires (4.3 percent). The United Kingdom is sixth with 71 (3.9 percent). Switzerland has 58 (4.3 percent), Brazil 50 (2.7 percent), France 39 (2.1 percent), and Italy 35 (1.9 percent).

Just to put things in perspective, the world’s 1,826 billionaires make up just 0.00003 percent of the global population.

Odds are you purchased a ticket for the $1.5 billion Powerball lottery—and, as you now know, you most certainly did not win.

But you already knew that state-sponsored lotteries represent a gigantic tax on the poor: they generate substantial regressive tax revenues, since low-income players spend a much higher proportion of their income on lotteries than anyone else.

What you might not know is that, at least in one country, the Supreme Court has recognized this problem and upheld the ban on lotteries enacted by one state, with the following argument:

Experience has shown that the common forms of gambling are comparatively innocuous when placed in contrast with widespread pestilence of lotteries. The former are confined to a few persons and places, but the latter infests the whole community; it enters every dwelling; it reaches every class; it preys upon the hard earnings of the poor; it plunders the ignorant and the simple.